Foreign-Born Number and Share of U.S. Population at All-Time Highs in January 2025
- External Source
admin
- 0
- 57 minutes read

The government’s January 2025 Current Population Survey (CPS) shows the foreign-born or immigrant population (legal and illegal together) hit 53.3 million and 15.8 percent of the total U.S. population in January 2025 — both new record highs. The January CPS is the first government survey to be adjusted to better reflect the recent surge in illegal immigrants. Unlike border statistics, the CPS measures the number of immigrants in the country, which is what actually determines their impact on society. Without adjusting for those missed by the survey, we estimate illegal immigrants accounted for 5.4 million or two-thirds of the 8.3 million growth in the foreign-born population since President Biden took office in January 2021. America has entered uncharted territory on immigration, with significant implications for taxpayers, the labor market, and our ability to assimilate so many people.
Highlights from the January 2025 data include:
- At 15.8 percent of the total U.S. population, the foreign-born share is higher now than at the prior peaks reached in 1890 and 1910. No U.S. government survey or census has ever shown such a large foreign-born population.
- The current numbers have rendered Census Bureau projections obsolete. Just two years ago, the Bureau projected the foreign-born share would not reach 15.8 percent until 2042.
- The 53.3 million foreign-born residents are the largest number ever in U.S. history; and the 8.3 million increase in the last four years is larger than the growth in the preceding 12 years.
- The above figures represent net growth. New arrivals are offset by outmigration and deaths in the existing immigrant population. Our best estimate is that 11.5 to 12.5 million legal and illegal immigrants settled in the country in the last four years.
- Although some immigrants are missed by government surveys, our preliminary estimate is that there are 15.4 million illegal immigrants in the January 2025 CPS, an increase of more than 50 percent (5.4 million) over the last four years in the survey.
- In the last four years, Latin America accounted for 58 percent (4.9 million) of the increase in the foreign-born, India 12 percent (958,000), the Middle East 8 percent (690,000), and China 7 percent (621,000).
- Of all immigrants, 60 percent are employed. As in any human population some work, but others are caregivers, disabled, children, elderly, or have no desire to work.
- Since 2000 the number of immigrants working has increased 83 percent and stood at 31.7 million in January 2025 — 19.6 percent of all workers.
- We estimate that 10.8 million illegal immigrants worked in the January 2025 data, accounting for some 6.7 percent of all workers. Illegal immigrants in particular are heavily concentrated in lower-skilled, lower-paid jobs, typically done by those without a bachelor’s degree.
- The rapid rise in immigrant workers has coincided with a significant increase in the share of U.S.-born (ages 16 to 64) men without a bachelor’s degree not in the labor force — neither working nor looking for work — from 20.3 percent in 2000 to 28.2 percent today.
Introduction
This report is part of a series of recent reports from the Center looking at the size and growth of the foreign-born population in the monthly Current Population Survey (CPS), sometimes referred to as the “household survey”. The CPS is collected each month by the Census Bureau for the Bureau of Labor Statistics (BLS).1 While the larger American Community Survey (ACS) is often used to study the foreign-born, the most recent version of the ACS reflects only the population through July 2023 and is now 18 months out of date. Further, as we discuss later in this report, the ACS has not yet been weighted to reflect the enormous increase in migration that the Census Bureau now estimates. In contrast, the CPS is reweighted at the beginning of each year, and the January 2025 survey is the first to more accurately reflect the Bureau’s most recent estimates.2 Because of this, the January 2025 CPS provides a more updated and accurate look at the current size of the foreign-born population than does the 2023 ACS.3
We use the terms “immigrant” and “foreign-born” interchangeably in this report.4 The foreign-born population as defined by the Census Bureau includes all persons who were not U.S. citizens at birth — mainly naturalized citizens, lawful permanent residents, long-term temporary visitors, and illegal immigrants. While the monthly CPS is a very large survey of about 110,000 individuals, the total foreign-born population in the data still has a margin of error of ±579,000 in January 2025 using a 90 percent confidence level. This means there is fluctuation from month to month in the size of this population, making it necessary to compare longer periods of time when trying to determine trends.5
Growth in the Foreign-Born Population
Recent Increase Is Unprecedented. Figure 1 reports the total number of foreign-born residents in the United States each January from 2009 to 2025. As discussed above, January is when the CPS is re-weighted based on the new population estimates, and comparing January to January is one way of looking at trends without being distracted by monthly fluctuations. Figure 2 shows every month over this same period with a confidence interval shown around each month to reflect sampling variability. Both figures show that growth during the Biden administration is dramatically greater than in the prior administrations. Looking at growth since January 2021 is a good point of comparison because it is just before the border surge began, and it also coincides with the start of the Biden administration. The numerical increase of 8.3 million in the last four years is larger than in any four-year period in American history.6 The 8.3 million increase in the four years from January 2021 to January 2025 is also larger than the 7.9 million increase in the 12 years prior. One would have to go back to December 2006 to exceed 8.3 million relative to January 2021. In effect, the growth in the immigrant population in the last four years is equal to the increase in the 14 years before January 2021.
 |
 |
Of course, during the latter part of the Trump administration Covid significantly curtailed immigration, so one can see his four years as artificially low. However, both Figures 1 and 2 show that the size of the immigrant population was trending downward before Covid hit in February of 2020. This implies that some of the decline during Covid might have happened anyway, especially given President Trump’s policies in the second half of his administration. The public-use data files of the ACS can be used to report individual year of arrival data, and the survey shows new arrivals did fall some during the three years before Covid — 2017 to 2019. But aside from the impact of Covid, monthly growth in Obama’s two terms averaged about 65,000, and it was 42,000 in Trump’s term through January 2020, before the pandemic hit. The 173,000-a-month average during President Biden’s term represented a complete break with pre-Covid trends.
Historical Perspective. Figure 3 shows the number of foreign-born residents and their share of the U.S. population since 1850, which was the first time they were identified in the census. At 53.3 million and 15.8 percent of the population, the foreign-born population is higher now than at any time in American history. The number of immigrants has increased more than five-fold since 1970, and nearly three-fold since 1990, and by more than two-thirds since 2000. As a share of the population, even in 1890 (14.8 percent) and 1910 (14.7 percent) during what is often called the “Great Wave” of immigration, the foreign-born were a smaller share of the population than they are today.7 The scale of recent immigration is so high it has made the Census Bureau population projections, published in November of 2023, nearly obsolete. The Bureau projected that the foreign-born share would not reach 15.8 percent of the U.S. population until 2042. When thinking about the impact on American society, it seems fair to assume that both the size of the foreign-born population and its share of the overall population matter.8
 |
A Resumption of Prior Trends? In our prior analysis we discuss at length the factors that have led to this extraordinary increase. They include public statements and policy changes by the Biden administration, such as the decision to end the Migrant Protection Protocols, Title 42, and the Asylum Cooperative Agreements with Central American countries. Perhaps the most important policy that contributed to the border crisis was the decision to release people encountered at the border and not use detention and expedited removal. Early on, detention and removal might have deterred more people from coming to the border. Legal immigration has also rebounded after Covid. Still, one might argue that the dramatic growth in the foreign-born population in recent years is just “making up” for the slowdown during Covid-19. Of course, there is no reason legal immigration had to return to pre-pandemic levels, as the number of immigrants admitted is a discretionary policy set by Congress. The scale of illegal immigration is also certainly not pre-determined, as the level of resources and commitment to enforce the law reflects each administration’s goals and policy choices.
Figure 4 shows the number of immigrants from the start of the Obama administration in January 2009 to January of this year and a line reflecting the pre-Covid-19 (January 2009 to February 2020) trend. The recent growth in the size of the foreign-born population has been above the long-term, pre-pandemic growth trend for at least two and a half years, which itself was very high. Figure 5 shows the same is true for the foreign-born share of the U.S. population. At least when measured this way, the resumption-of-prior-trends-argument is not valid. The recent increase is dramatically larger than the already very substantial pre-Covid increases in the immigrant population.
 |
 |
New Arrivals. When thinking about the recent huge increases in the foreign-born population, it is important to remember that they represent a net increase; the number of new arrivals has to be larger than the net increase because new arrivals are always offset by deaths among the existing population and emigration, sometimes called outmigration. The foreign-born population can grow only from new immigration, since all births to the foreign-born in the United States add only to the native-born population by definition. This means that the number of new arrivals must be higher than the growth in the foreign-born population. After reviewing the literature in 2022, the Census Bureau estimated that 1 to 1.5 percent of the foreign-born likely leave the country annually, though this was based on data prior to Covid. If we apply these rates, then between 2021 and 2025, two to three million immigrants left the country. Further, there were 1.2 million deaths among the foreign-born over this time period as well. Adding these numbers to growth (8.3 million) means that 11.5 to 12.5 million (2.9 to 3.1 million annually) new legal and illegal immigrants arrived in the country during the last four years but were offset by emigration and mortality, so that the foreign-born population grew by “only” 8.3 million.
The above estimate takes the CPS data as given; we do not attempt to adjust for undercount. While deaths are based on immigrants’ demographics, emigration and new arrivals are harder to determine. It is certainly possible that emigration of the foreign-born was lower during the Biden Administration, given cutbacks in interior enforcement. If it was, then new arrivals must have been correspondently lower.9 Still, even if emigration was only 1.5 million over the last four years, it would still mean that the number of new legal and illegal immigrants was 11 million (2.75 million a year) from the beginning of 2021 to the end of 2024.
The Year of Entry Question. The year of entry question in the public-use CPS can provide some insight into the scale and composition of recent immigration. In odd-numbered years like 2025, the most recent arrival cohort that can be identified are those that came in the prior three years — 2022 to 2024.10 In 2023, the most recent arrivals would be from 2020, 2021, and 2022. (Responses to the year of entry question are grouped by the Bureau in the CPS into multi-year cohorts to preserve anonymity.)11 There is some overlap when comparing consecutive odd-numbered years. Figure 6 shows that in January of this year, 6.5 million immigrants indicated that they arrived in 2022, 2023, and 2024, much higher than at any time in the last three decades. As high as this number is, it does not line up with the enormous increase in the foreign-born population from January 2022 to January 2025, which was 6.74 million. As already discussed, new arrivals should be a good deal higher than the net growth in the foreign-born population because the number of newcomers is offset by outmigration and deaths, not the other way around. But there are a few possible explanations for this seeming discrepancy.12
 |
Net Migration. Net migration refers to the difference between the number of people coming versus the number going. The Census Bureau estimate of net international migration (NIM) includes the arrival and departure of both immigrants and the U.S.-born. In most years, the coming and going of the U.S.-born is very roughly balanced. The Bureau’s estimate of NIM, along with administrative data on deaths and births, are used to construct its annual estimate of the size and composition of the U.S. population.
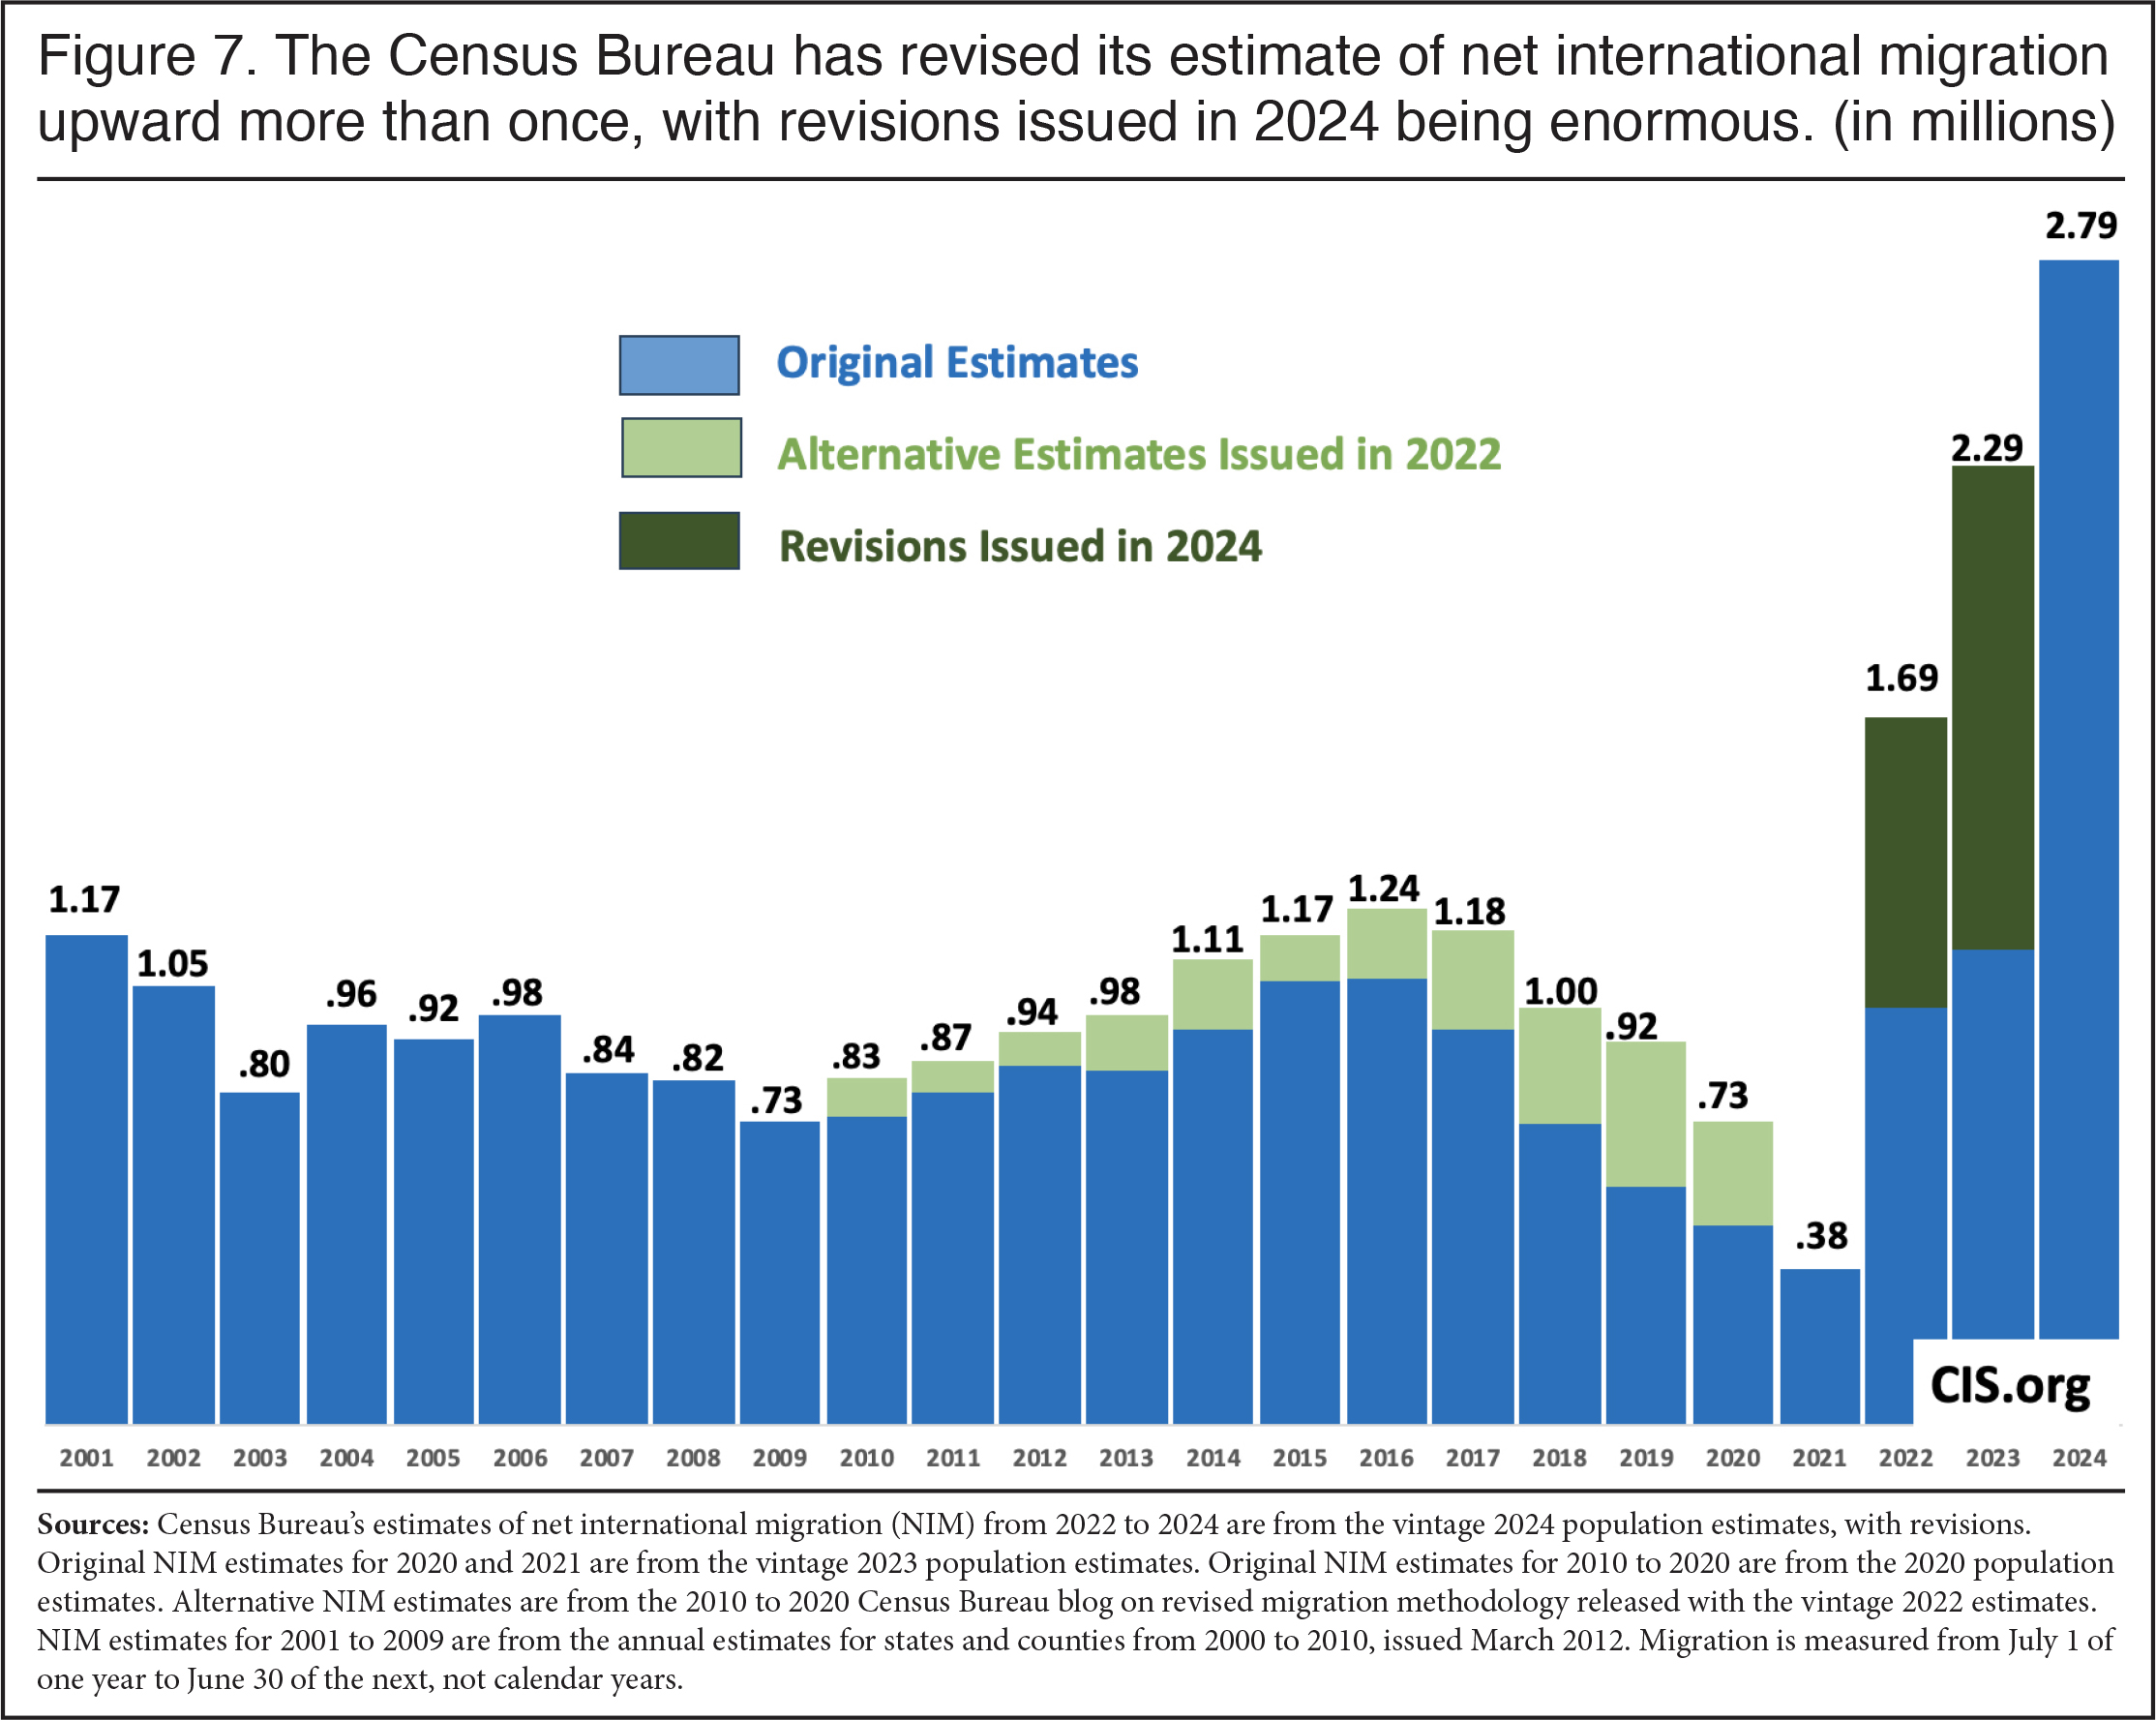
The population estimates are also used to weight all Census Bureau surveys, including the CPS. Figure 7 shows that even before Covid and the border crisis, the Bureau struggled to estimate NIM.13 In 2022, the Bureau developed a new methodology for measuring NIM and issued alternative estimates of NIM for 2010 to 2020, which it released with its 2022 population estimates. The alternative estimates increased migration by 1.94 million over this time period. Regarding this upward revision we wrote, “[T]heir new methodology while almost certainly an improvement is still not able to fully reflect the … on-going border crisis.” As Figure 7 shows, when the 2024 population estimates were released, the Census Bureau again adjusted their estimate of NIM upward, this time dramatically, increasing their estimate by a combined 1.85 million for 2022 and 2023. For 2024, their estimate of NIM was 2.79 million, which is completely unprecedented. The recent revisions in NIM were not reflected in any ACS or CPS until January of this year. For this reason, the January 2025 data provides a more accurate estimate of the size of the foreign-born population.14
 |
An Increase in Immigration from Latin America
Latin American New Arrivals. As already mentioned, Figure 6 shows that the 6.5 million immigrants who said they came to the U.S. in the three years prior to 2025 is the largest number of new arrivals in any three-year period in the last 30 years reported in the CPS.15 The nearly 3.8 million newcomers from Latin America represented 58 percent of all new immigrants. This finding is consistent with other recent reports we have published showing that much of the recent increase in immigration has been due to immigrants from this part of the world. Figure 6 shows it has been 20 years since Latin America accounted for such a larger share of new arrivals, at least based on odd-numbered years of the CPS. Prior to Covid in 2019, immigrants from the region were only 38 percent of all those who had come in the prior three years. Numerically, the number of immigrant newcomers from Latin America is up by 2.2 million and accounts for the overwhelming majority of the increase in arrivals relative to pre-Covid levels.
Growth by Sending Region and Country. Table 1 (download Excel file here) shows the numerical growth in the total foreign born for a few top sending countries and by region.16 In the last four years, Latin America accounted for 58 percent (4.9 million) of the increase in the foreign-born population, India 12 percent (958,000), the Middle East 8 percent (690,000), and China 7 percent (621,000). While Latin America drove the record increase in the foreign-born population in the last four years, other regions clearly also grew significantly. Figure 6 and Table 1 together make clear that the recent increase in the foreign-born population is due largely to an enormous increase in immigration from Latin America. As we will discuss later in this report, this is powerful prima facie evidence that the CPS is picking up the massive surge in illegal immigration that began in 2021. Illegal immigration is primarily, though by no means exclusively, from that region. One other observation that should help inspire confidence in this data is the huge increase in Venezuelan immigrants in the table. Conditions in that country, along with the decision by the Biden administration to include them in the CHNV program, help explain the huge increase in Venezuelans. The ability of the CPS to capture this growth is impressive given how many of these immigrants are new arrivals and have irregular immigration status.
Illegal Immigrants in the CPS. In March 2022 we reported our estimate of the illegal immigrant population using the CPS. We defined illegal immigrants as all foreign-born residents who are not naturalized citizens, permanent residents, or who have valid temporary visas.17 Our estimate of illegal immigration does include those with pending asylum applications and parolees.18 The discussion that follows builds on our prior estimates. We hope to continue to refine and improve our method for estimating illegal immigration as more information becomes available in the future. As we did in 2022, we use the available administrative data on legal immigration (including long-term temporary visitors) and make reasonable assumptions about out-migration and mortality. We use this information to estimate the post-1980 legal immigrant population in the CPS. We find that the number of post-1980 immigrants grew from 28.4 million in January 2021 (our prior estimate), to 31.4 million in January 2025.19,20 The January 2025 CPS shows 46.8 million post-1980 immigrants (legal and illegal) in the country.21 If our estimate of the post-1980 legal population is correct, then there were 15.4 million illegal immigrants in the January 2025 CPS (46.8 million minus 31.4 million).22
It should be kept in mind that this estimate is not the number of new illegal immigrants who arrived over this time but rather the net increase in the CPS data. However, a considerable number of illegal immigrants leave the country each year; some are formally removed, but most of the departures are voluntary. Equally important, a substantial number also “leave” the illegal population by legalizing, such as successful asylum cases, those granted various forms of “humanitarian relief”, and those who are sponsored by an American spouse or other family member.23 At roughly 250,000 deaths over four years, the mortality rate among illegal immigrants is relatively low compared to the general population and is a smaller number than emigration and legalizations. Still, the cumulative number is not trivial.
The Recent Increase in Illegal Immigrants. Compared to our 2021 estimate of 10 million illegal immigrants in the CPS data, the number of illegal immigrants in the survey increased by 5.4 million by January 2025, more than a 50 percent increase. This represents nearly two-thirds (65 percent) of the 8.3 million overall increase in the total foreign-born population since January 2021 in the data. This is somewhat higher than our prior estimates that growth in the illegal population accounted for 60 percent of the total increase since the start of the border crisis in 2021.24 In the past, we adjusted upward our CPS-based estimates of illegal immigrants by 2.25 percent to reflect those missed by the survey.25 Figure 8 shows our estimate for the total illegal population in January 2025 is 15.8 million and our other estimates since 2021 assuming the level of undercount.26
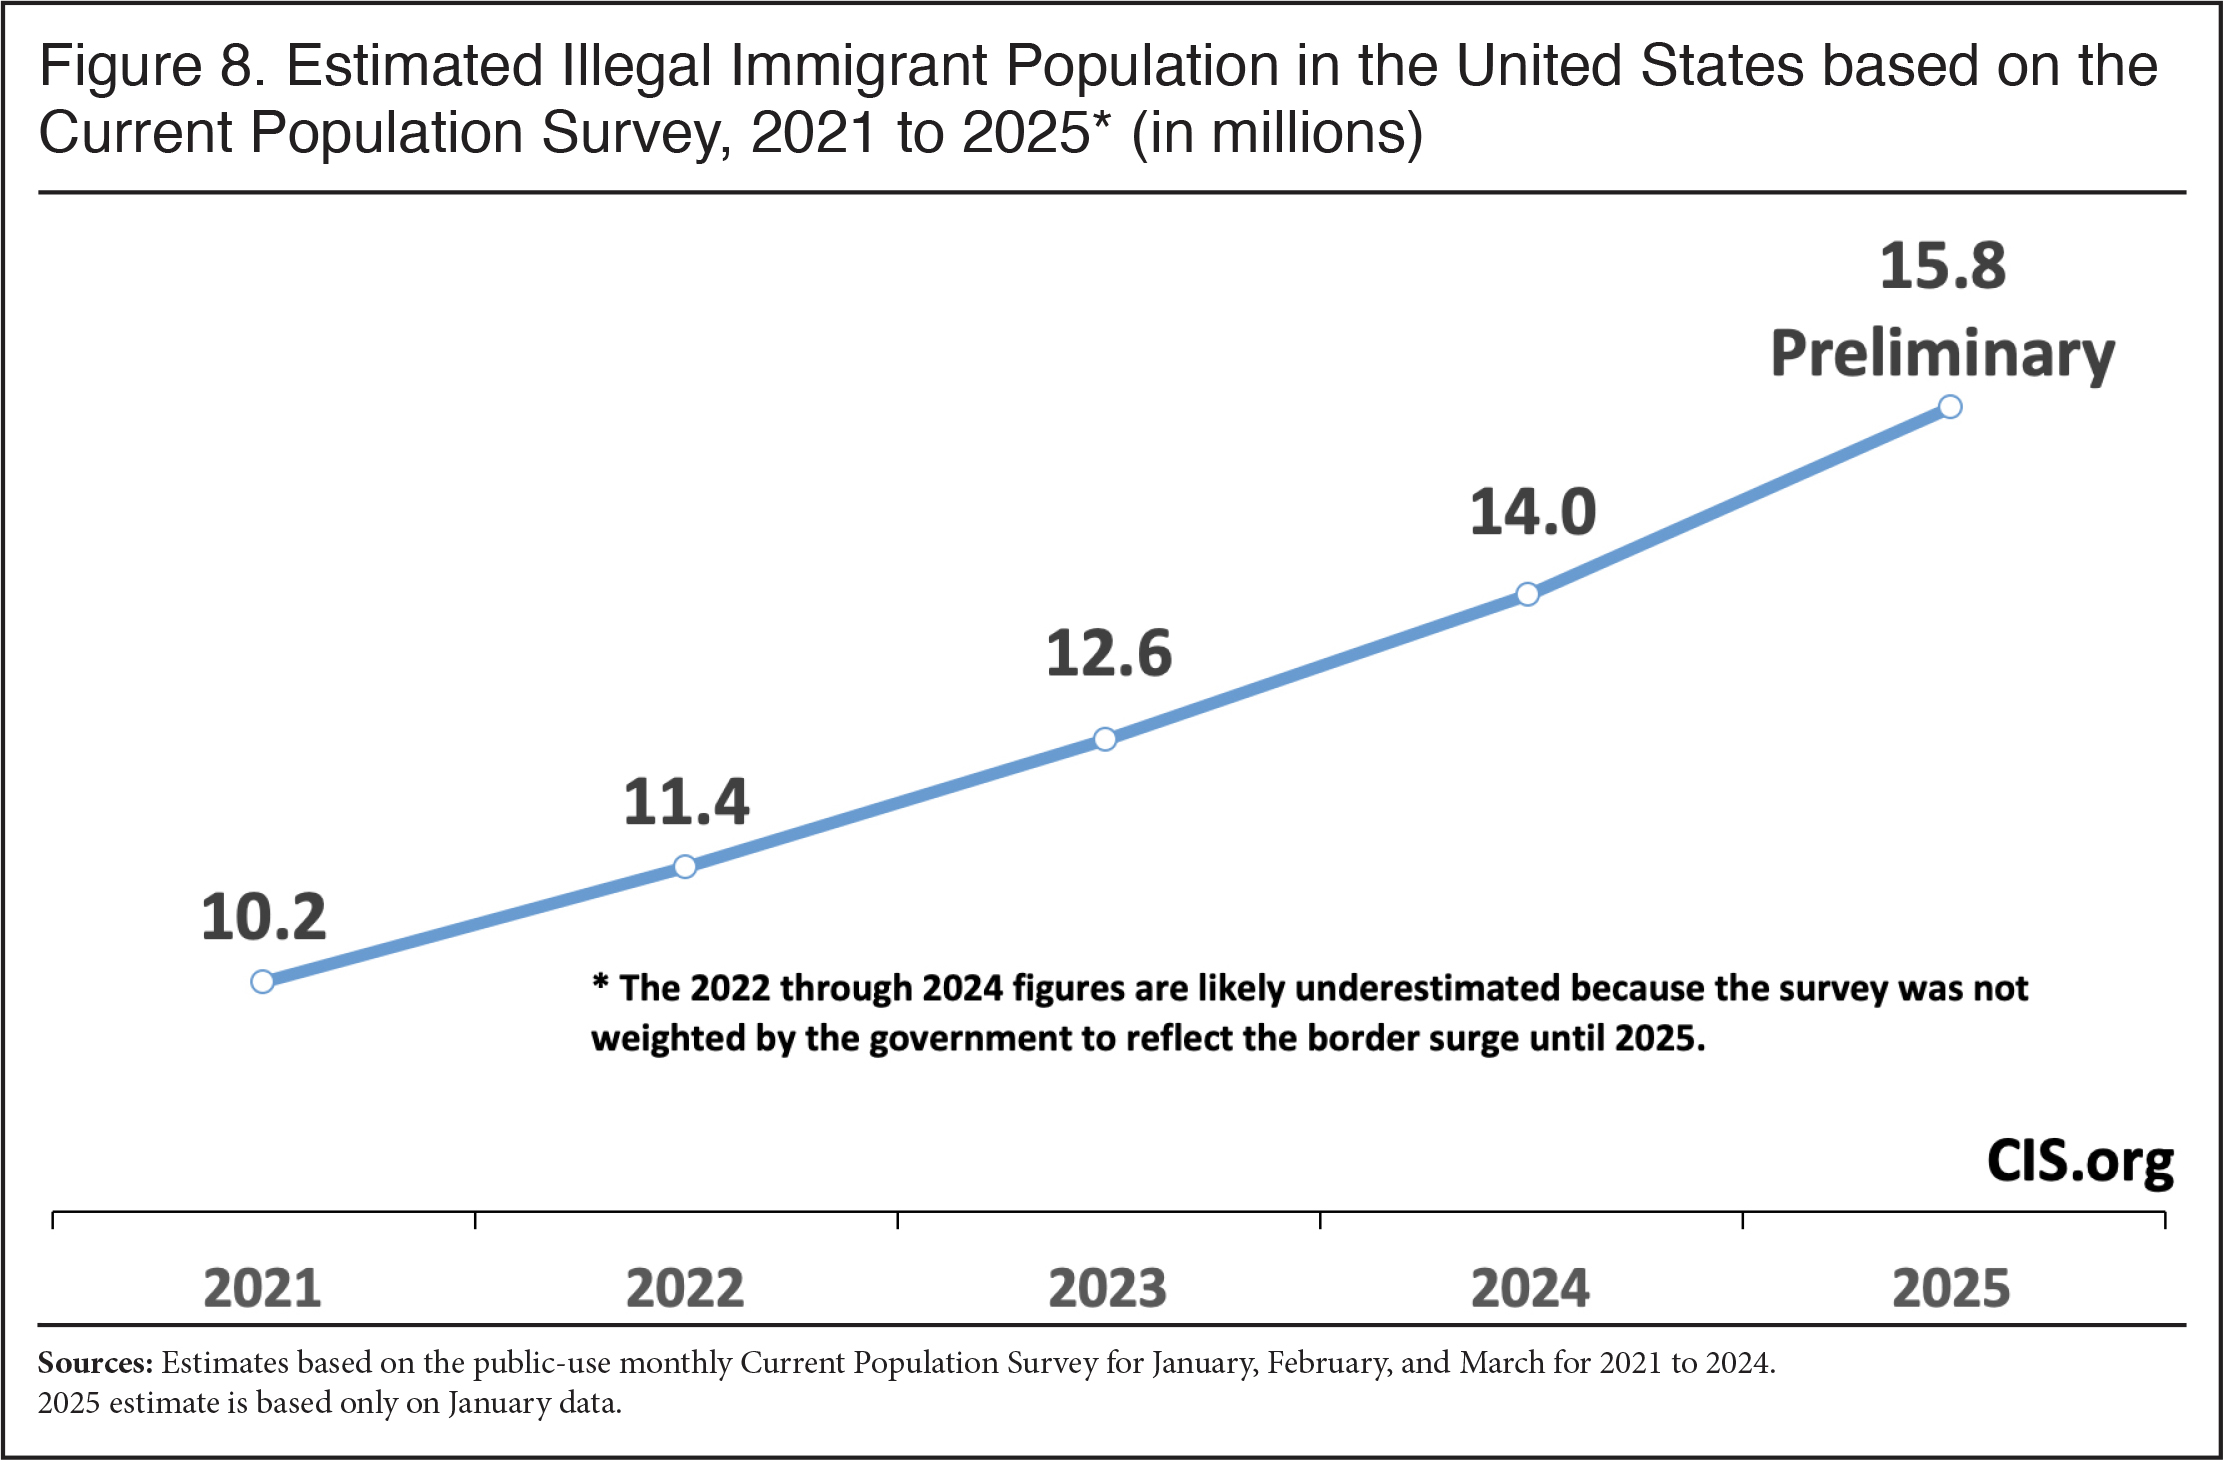 |
Our 2023 and 2024 estimates may be too low even after we adjust for undercount.27 These were years in which the illegal population was surging, yet, as already discussed, the sample weights in the CPS did not fully reflect this surge until January 2025.28 Having said this, Figure 8 shows that the total illegal immigrant population grew from 10.2 million (undercount adjusted) to 15.8 million (undercount adjusted), an increase of 5.6 million. This is certainly huge, but our CPS-based estimate may ultimately prove to be too low given the more than seven million illegal immigrants released by the administration into the country. The seven million figure includes 530,000 brought in using the CBP One app under the CHNV program, but it does not include the 1.66 million “got-aways” at the border reported in fiscal years 2021, 2022, and 2023 (FY 2024 numbers are not yet available). The above figures also do not include visa overstayers or the unknown number of illegal immigrants who slipped past the Border Patrol unseen.
Indirect Evidence of Illegal Immigration. In general, illegal immigrants should show up in Census Bureau surveys as having arrived in 1980 or later because of the 1986 IRCA amnesty.29 This is the reason why we subtract the post-1980 foreign-born population from our estimate of legal immigrants to arrive at an estimate of illegal immigrants in the data. Most illegal immigrants should also identify as non-citizens. Prior research by DHS, the Pew Research Center, the Center for Migration Studies, and the Migration Policy Institute all indicate that roughly three-fourths of all illegal immigrants are from Latin America. We also know that 86 percent of all border encounters from January 2021 to October of 2024 are from Latin American countries.30 As a result, the post-1980 foreign-born population in general, and the non-citizen Latin American immigrant population in particular, should show the same trends as our estimates of illegal immigrants. Figure 9 reflects this. Moreover, the relative lack of growth in the post-1980 Latin American non-citizen population shown in Figure 9 from January 2010 to January 2020 is consistent with estimates published by the above organizations showing that the size of the illegal immigrant population was relatively stable in the years before Covid.
 |
Immigrants and the Labor Market
Employment Among Newcomers. There is a tendency for many observers to think of immigrants one dimensionally: as simply workers. Figure 10 shows that slightly less than half (3.2 million) of all new arrivals were employed at the start of 2025. While seemingly low, it must be remembered that it takes time for immigrants to secure employment, and the share of new arrivals employed is actually higher in 2025 than during prior economic expansions.31 We also expect that over time the share of immigrants who arrived in the last three years who eventually find work will increase as they become more familiar with the U.S. job market. All of that said, there is no question that the recent surge in immigration has provided employers with millions of workers. But it has also added 3.3 million non-workers to the country as well. This is a simple, but powerful reminder that immigrants are people, not simply workers.
 |
Of the 53.3 million immigrants living in the country in January 2025, 60 percent (31.7 million) were working in January (See Table 2.) Compared to 2020, the number of immigrants working is up 4.7 million, while the number of non-working immigrants is up 4.2 million. There is nothing particularly surprising about any of these numbers and shares. As in any human population, some work, but others are caregivers, disabled, children, elderly, students, or have no desire to work. Among all immigrants ages 16 to 64, 30 million are working (72.7 percent) and 31.4 million are in the labor force. For those who arrived in the last three years and are ages 16 to 64, 62.6 percent are working, and 69.2 percent are in the labor force. The bottom line is that immigration adds millions of workers, but it unavoidably also adds millions of non-workers.
Types of Job Immigrants Do. Figure 11 reports the immigrant share of occupational categories in January 2025. Immigrants tend to comprise the largest share of workers in lower-skilled occupations, though they are also a significant share in some more skilled occupations. Of the occupations shown in orange in Figure 11, 87.2 percent of the workers do not have a bachelor’s degree. Equally important, the figure also shows that there are still millions of U.S.-born workers in high-immigrant occupations. The “immigrants only take jobs Americans do not want” argument is not supported by the data. The majority of workers in every broad job category are U.S.-born, even in the lowest-paid, lowest-status categories. The occupational categories reported in Figure 11 are highly aggregated because of the sample size of the monthly CPS. However, our prior analysis of all 474 occupations as defined by the Department of Commerce showed only a tiny number of jobs were majority immigrant. To be sure, using so many immigrants to fill such a large share of jobs pleases employers. But by increasing the supply of workers, immigration exerts a downward pressure on wages, which is why employers understandably tend to want ever more immigration. This may reduce consumer prices, though any impact on prices has to be quite small. But reducing the earnings of American workers in the lowest-paid occupations in particular seems neither fair nor wise, as it makes the least-educated and poorest U.S.-born workers even poorer.
 |
Increase in the U.S.-Born Not in the Labor Force. Table 2 (download Excel file here) reports labor force statistics for the U.S.-born and immigrants since 2000. Columns 1 and 2 in the table show the 31.7 million immigrant workers in January 2025 were 19.6 percent of all workers. This represents an 83 percent increase in the number of immigrant workers since 2000. Table 2 also shows one of the most troubling trends in the U.S. labor market — the increasing share of working-age, U.S.-born men not in the labor force. Column 6 shows that, of all working-age U.S.-born men, the share not in the labor force is up more than five percentage points since 2000, though the share not in the labor force in January 2025 roughly returned to what it was in January 2020, right before Covid. The increasing share of U.S.-born men not in the labor force is primarily among those without a bachelor’s degree. Comparing each peak of an economic expansion (rows in bold) over the last two and a half decades, Column 8 shows a very large increase in the share of U.S.-born men (16 to 64) without a college degree not in the labor force: from 20.3 percent in 2000 to 28.2 percent in January 2025.32 The share out of the labor market is still slightly higher in 2025 than in 2020 before Covid, even though the current job market is often described as the best ever.
Column 10 shows the number of non-college, U.S.-born men who would be in the labor force if the rate had remained as it was in 2000. In January 2025 there would have been 4.6 million more U.S.-born less-educated men in the labor force had their participation in the labor force not deteriorated after 2000. Column 11 indicates that even among “prime-age” U.S.-born men (25 to 54), the group most likely to work, the share not in the labor force has increased from 10.5 percent in 2000 to 15.7 percent in 2025. All of this matters because a large body of research shows that being out of the labor force is associated with serious social problems, from crime and social isolation to overdose deaths and suicide. Nicholas Eberstadt’s book Men Without Work is considered one of the best discussions of this decades-long problem.
The extent to which immigration impacts U.S.-born workers is debated, but there is a significant body of research showing negative impacts on labor market outcomes for some U.S.-born workers. The larger issue is that filling ever more jobs with immigrants has allowed employers, policy-makers, and the public in general to ignore the dramatic deterioration in the labor force participation of less-educated U.S.-born men and the resulting social pathologies. Reducing immigration and allowing wages to rise would certainly be helpful in drawing more men into the labor force. Most importantly, the availability of immigrant labor certainly reduces the incentive for the United States to undertake the difficult reforms necessary to address this serious social problem.
Illegal Immigrant Workers. Our current method for estimating illegal immigrants applies to the entire illegal population, not specifically those who are employed. The Pew Research Center and the Center for Migration Studies (CMS) both estimate that about 75 percent of all illegal immigrants were working in 2022 — 8.3 million out of their estimate of roughly 11 million total. Using the 75 percent figure of Pew and CMS would mean that there are 11.6 million immigrant workers in the CPS based on our estimates. In our view, Pew, and CMS’s estimates of the share of illegal immigrants working seems too high. For example, of all non-citizen Latin Americans who arrived in 1980 or later only 61.9 percent were working in January 2025 and 66.1 percent were in the labor force — working or looking for work. While further study is needed, we estimate 70 percent of illegal immigrants are employed. If we are correct, then there are some 10.8 million employed illegal immigrants in the CPS, before undercount adjustment. This makes 6.7 percent of all workers in the survey. Using the 70 percent rate and our modest undercount adjustment would put the number of illegal immigrants working at 11.1 million. But this is clearly an area we will need to investigate further to refine our estimates.
Conclusion
Our analysis of the January Current Population Survey (CPS), the first government survey to be weighted to reflect the border surge, shows 15.8 percent of the U.S. population is now foreign-born — the largest share ever in U.S. history. The dramatic increase in the foreign-born share in recent years has rendered the Census Bureau’s population projections obsolete. Just two years ago the Bureau projected that the foreign-born share would not reach 15.8 percent until 2042. The other large survey often used to measure the foreign-born population, the American Community Survey (ACS), has data only through the middle of 2023 and has not been weighted to reflect the surge of illegal immigration that began in 2021. Based on the most recent CPS, the total foreign-born population grew by 8.3 million from January 2021 to January 2025, the largest increase ever in a four-year period. The scale of immigration (legal and illegal together) into the United States over this time period is without any precedent.
We estimate that slightly less than two-thirds (5.4 million) of the recent increase in the data is from illegal immigrants. Overall, we find that there are 15.4 million illegal immigrants in the January 2025 CPS, accounting for 29 percent of the total foreign-born in the survey. While we are uncertain about the scale of the undercount in the CPS, using our prior approach to this question places the total illegal immigrant population at 15.8 million in January 2025. The enormous scale of legal and illegal immigration has profound implications for a host of issue areas from schools and public coffers to the labor force and housing markets. Perhaps the most fundamental questions these numbers raise is whether the United States can successfully integrate and assimilate all the immigrants already here, let alone continue to welcome additional newcomers each year.
Much of the news coverage on immigration has focused on the workers it provides employers. There were 31.7 million immigrant workers in January 2025, and they account for nearly 20 percent of all workers. The number of immigrant workers is up by 14.4 million (83 percent) since 2000. Compared to January 2020, right before Covid, the number is up by 4.7 million (17 percent). Immigration clearly adds to the labor force, but only about 60 percent of immigrants are workers. Immigrants are human beings, and some are too old or too young to work, while others are unable to work or do not wish to do so. Immigration adds millions of workers and non-workers alike.
The dramatic increase in immigrants in the workforce has occurred at a time when the share of working-age U.S.-born men without a bachelor’s degree not in the labor force has increased dramatically. The large share of working-age men not in the labor force is linked to profound social problems like crime and overdose deaths. If the same share of working-age, U.S.-born men without a bachelor’s degree were in the labor force in January 2025 as there were in 2000, it would add 4.6 million to the workforce. The availability of immigrant labor has allowed the country, including policy-makers, to largely ignore this deterioration and instead rely on ever-larger numbers of foreign-born workers to fill jobs. This is particularly true in many lower-skilled and lower-wage occupations. When formulating policy, the wide-ranging impacts of immigration need to be carefully considered, not merely the perspective of employers who wish to hire more foreign workers.
End Notes
1 The primary purpose of the survey is to collect information about the U.S. labor market, such as the unemployment rate. Starting in 1994 questions about citizenship, country of birth, and year of arrival were added.
2 The BLS reports that if the new weights are applied back to the December 2024 CPS, it adds 2.87 million people to the 16-plus population in the United States. The BLS is very clear that the increase in the population was due to the Bureau’s new, dramatically higher estimate of migration. Being foreign-born is not a control variable (e.g. race, age, and sex) and is therefore allowed to vary in the survey based on responses, like the unemployment rate. However, being foreign-born is correlated with race. When the data was weighted to reflect the Census Bureau’s new, higher estimate of net international migration, it significantly increases Asians and Hispanics in the survey, which in turn increases the foreign-born in the survey as well.
3 We can see just how much reweighting net migration adds to the size of the foreign-born population in the CPS by comparing the 51.8 million shown in the December 2024 CPS to the 53.3 million in the January 2025 data.
4 The term “immigrant” has a specific meaning in U.S. immigration law, which is all those inspected and admitted as lawful permanent residents (green card holders). In this analysis, we use the term “immigrant” in the non-technical sense to mean all those who were not U.S. citizens at birth.
5 The margins of error shown in Figure 3 and reported elsewhere in the analysis are based on standard errors calculated using parameter estimates and an adjustment for foreign-born respondents, reflecting the survey’s complex design. To the best of our knowledge, neither the BLS nor the Census Bureau has provided parameter estimates or an adjustment specifically for the foreign-born that applies to the general population in the monthly CPS. For this reason, we use the parameter estimates and foreign-born adjustment provided by the government for the labor force.
6 Although the CPS did not identify immigrants until 1994, information in prior censuses and administrative data make clear that the foreign-born population never grew by 8.3 million in a four-year period. Looking at Figure 4, we see that, historically, it is simply not possible in the years prior to 1994 for there to have been a four-year period since 1850 in which the foreign-born population grew by 8.3 million. We know this in part because Table 1 of the Yearbook of Immigration Statistics shows nowhere near enough legal permanent immigrants on an annual basis for the foreign-born population to grow by this amount in any four-year period. Prior to 1960, illegal immigration was not a significant contributor to growth in the foreign-born population. Also, responses to the year of entry question in the 1990 or 2000 censuses, the two decades in which the foreign-born population grew the most numerically, indicates that there was never a period in the 1980s or 1990s when the foreign-born population could have come close to growing by 8.3 million in just a four-year period.
7 The CPS does not include the institutionalized population, which is included in the decennial census and American Community Survey (ACS) used to measure the foreign-born population from 1850 to 2020 in Figure 3. The institutionalized are primarily those in nursing homes and prisons. We can gauge the impact of including the institutionalized when calculating the foreign-born percentage by looking at the public-use 2023 ACS, which shows that when those in institutions are excluded, it changes the foreign-born share of the total population by less than one-tenth of 1 percent. This small increase is because immigrants are a somewhat smaller share of the institutionalized than they are of the non-institutionalized. However, the institutionalized population is not very large relative to the overall population, so it makes very little difference to the foreign-born share of the total population. Also, the distribution of immigrants in the institutionalized and non-institutionalized population changes very little from year to year. The inclusion of the institutionalized in January 2025 might have reduced the foreign-born share of the overall population by about one-tenth of 1 percent. A one-tenth of a percentage point reduction in the foreign-born share from 15.8 to 15.7 percent would still be a new record high. Also, the margin of error for the foreign-born share of the population in the monthly CPS is ± 0.2 percent, assuming a 90 percent confidence level. But even the lower bound of the confidence interval would still place the foreign-born share well above the 14.77 percent in 1890, which also likely had some error that is lost to history. The bottom line is that we can say with confidence that at 15.8 percent the foreign-born percentage in the January 2025 CPS is the highest share ever recorded in American history.
8 When considering the impact of immigration on the country, the foreign-born share may seem like the only factor that matters. While percentages are important, the absolute size matters as well. For example, when thinking about the successful integration of immigrants, 500,000 foreign-language speakers may be enough to create linguistic and cultural enclaves, whether this 500,000 constitutes 10 percent of an urban area or 30 percent.
9 If emigration was higher, it would mean that new arrivals are also higher.
10 Technically the January 2025 data could include a few immigrants who arrived in the first week or two of the month if they joined a household already in the survey. But the “control” or “reference date” is in the middle of the month (the week of the 12th to 18th). This means that there should be almost no immigrants in the January data from each year who came in that same year. The most recent cohort in the January 2025 data are those who came in in 2022, 2023, and 2024.
11 There were also 3.05 million immigrants in January 2025 who indicated that they came in 2020 or 2021, which is the next most recent cohort that can be identified in the data.
12 Several factors likely account for this difference. First, there are margins of error around all of these numbers. The margin of error for the 6.5 million arrivals in the three years prior to 2025 is ±143,000 using a 90 percent confidence level. Moreover, the margin of error around the total foreign-born population of 53.3 million in January 2025 is ±579,000, and it was ±554,000 for the 46.6 million in January 2022. Perhaps more important, capturing newly arrived immigrants is difficult, so the undercount in the CPS is likely heavily concentrated among the newest immigrants. Further, the new arrivals figures in the CPS do not capture those who came and left within the three years preceding 2025. Finally, people who had lived in the United States previously and returned in 2022 to 2024 might have told the Census Bureau they came to the United States during their prior stay and not the most recent year they arrived, thereby adding to the overall foreign-born but not recent arrivals. There are also likely other forms of misreporting of year of entry in the survey. For example, there is the well-known phenomena of “clumping” in survey data whereby people report round numbers. The year 2020 would be an example of a value people may misreport if they arrive a year or two later. All of these factors likely explain why the arrivals data for 2022 to 2024 in the January 2025 CPS, though extremely high, seems low relative to growth in the immigrant population. The estimate of the total foreign-born population in the CPS is a much more statistically robust number because it is based on the much larger sample of all immigrants compared to the estimate of new arrivals in the survey, which is based on the much smaller number of newcomers.
13 Net migration and the population estimates are all measured by the Census Bureau from July 1 of each year.
14 One factor to consider is that Census Bureau surveys are not re-weighted retrospectively to reflect the estimate of NIM.
15 See end note 10.
16 Countries included in each sending region using the CPS in 2024 are: Non-Mexico Latin America: Belize, Costa Rica, El Salvador, Guatemala, Honduras, Nicaragua, Panama, Cuba, Dominican Republic, Haiti, Jamaica, Bahamas, Barbados, Dominica, Grenada, Trinidad and Tobago, Antigua and Barbuda, St. Kitts-Nevis, St. Lucia, St. Vincent and the Grenadines, Caribbean n.s., Argentina, Bolivia, Brazil, Chile, Colombia, Ecuador, Guyana/British Guiana, Peru, Uruguay, Venezuela, Paraguay, South America n.s., Americas n.s.; East Asia: China, Japan, Korea, Mongolia, Cambodia, Indonesia, Laos, Malaysia, Philippines, Singapore, Thailand, Vietnam, Burma, Asia n.e.c./n.s.; South Asia: India, Bangladesh, Bhutan, Pakistan, Sri Lanka, Nepal; Middle East: Afghanistan, Iran, Iraq, Israel, Jordan, Lebanon, Saudi Arabia, Syria, Turkey, Kuwait, Yemen, United Arab Emirates, Uzbekistan, Kazakhstan, Egypt/United Arab Rep., Morocco, Algeria, Sudan, Libya; Sub-Saharan Africa: Ghana, Nigeria, Cameroon, Cape Verde, Liberia, Senegal, Sierra Leone, Guinea, Ivory Coast, Togo, Eritrea, Ethiopia, Kenya, Somalia, Tanzania, Uganda, Zimbabwe, South Africa (Union of), Zaire, Congo, Zambia, Africa n.e.c./n.s; Europe: Denmark, Finland, Iceland, Norway, Sweden, United Kingdom, Ireland, Belgium, France, Netherlands, Switzerland, Greece, Italy, Portugal, Azores, Spain, Austria, Czechoslovakia, Slovakia, Czech Republic, Germany, Hungary, Poland, Romania, Bulgaria, Albania, Yugoslavia, Bosnia and Herzegovina, Croatia, Macedonia, Serbia, Montenegro, Estonia, Latvia, Lithuania, Other USSR/Russia, Ukraine, Belarus, Moldova, USSR n.s., Europe n.s., Armenia, Azerbaijan, Georgia; Elsewhere: Bermuda, Australia, New Zealand, Fiji, Tonga, Samoa, Marshall Islands, Micronesia, Other n.e.c. and unknown. In the data “n.s.” stands for “not specified” and “n.e.c.” means “not elsewhere classified”.
17 Those who entered without inspection (EWIs), visa overstayers, and all those with deferred action, including those with Deferred Action for Childhood Arrivals (DACA) and those with Temporary Protected Status (TPS), are included in our estimates of illegal immigrants.
18 We also include those with pending defensive asylum applications, as well as parolees. All of the above individuals are inadmissible aliens under the Immigration and Nationality Act (INA), and the vast majority are subject to removal. Some researchers might not count most parolees as illegal immigrants. It is our understanding, for example, that the Center for Migration Studies excludes “most of the large number of people that have entered the asylum backlog since 2021”. The extent to which parolees and asylum applicants are illegal immigrants can be debated because they are not “accruing unlawful presence” under the INA, even though they are by definition “inadmissible aliens”. Parolees are almost always individuals not eligible for any type of visa or other means of entering the country legally. Like defensive asylum applicants released at the border (the two groups often overlap), parolees have not been lawfully admitted into the United States and have no lawful immigration status. Therefore, we include them in our estimates for illegal immigrants. In January 2021 when the Biden administration took office, the number of pending asylum applicants and parolees was dramatically smaller and so did not really impact our estimate for January 2021. By 2025, however, there may be some two million individuals with parole or who have pending asylum applications.
19 This includes an adjustment down from the actual legal immigrant population because of undercount in the survey. To be clear, more than three million new permanent and temporary immigrants arrived over this time period, but the arrivals are offset by deaths and emigration. Temporary visa holders (known as non-immigrants) in particular have very high rates of emigration.
20 It is important to note that these figures are for post-1980 arrivals, not the entire foreign-born population. The post-1980 legal immigrant population is smaller than the total legal immigrant population. For a more detailed discussion of how we estimate the size of the total illegal immigrant population, see Steven A. Camarota and Karen Zeigler, “Estimating the Illegal Immigrant Population Using the Current Population Survey”, Center for Immigration Studies, March 29, 2022. The key administrative data necessary for updating our prior estimate of the legal immigrant population comes from the State Department’s Bureau of Consular Affairs website at “Monthly Immigrant Visa Issuance Statistics”; the Department of Homeland Security website for the number of adjustment of status reports, the Refugee Processing Center’s website; and the Executive Office for Immigration Review’s Adjudication Statistics. The resident population of long-term temporary visitors is the most difficult to estimate. The government’s most recent estimate of this population is for 2019. Estimating the current number of guestworkers is the most difficult. The number of foreign students had returned to pre-pandemic levels by the 2023/2024 school year, and we estimate it was slightly larger by January 2025 based on State Department figures.
21 The foreign-born population who arrived before 1980 should contain virtually no illegal immigrants because the IRCA amnesty should have legalized them, and the passage of time further reduces the illegal immigrant population that came in this time period. Also, because of special provisions in the law that have allowed Cuban immigrants to adjust to legal status, we exclude them from this population as well.
22 It is important to remember these figures are for post-1980 legal immigrants, not for the entire population of legal immigrants. The overall population of legal immigrants grew more slowly because post-1980 legal immigrants have relatively lower death rates compared to pre-1980 legal immigrants, and of course new arrivals add to the post-1980 population every year.
23 More than 50,000 people are granted asylum each year. Other forms of humanitarian relief include cancelation of removal, victims of human trafficking, and green cards awarded to the victims of crime and their families. In fiscal years 2021 to 2023 more than 56,000 individuals benefited from just these three less-well-known forms of relief. Virtually every one of these individuals were illegal immigrants and represent “departures” from that population.
24 One key reason for this is that the January 2025 data shows a much larger post-1980 population because it utilizes the new weights.
25We used this small adjustment in the past so that our earlier estimate would roughly match those from DHS estimates of the unauthorized. We are uncertain if the small upward adjustment still makes sense.
26 In addition to limited administrative data for 2025, a better understanding of how the emigration rates of both legal and illegal immigrants might have changed in the last four years would help improve our estimates.
27 The revised NIM estimates for 2022 and 2023 reported in Figure 7 and the huge NIM estimate for 2024 were not used for these years. The revised estimates of 2022 and 2023 for NIM were not even issued until the end of 2024. The 2024 estimate of 2.79 million also came out at the end of 2024 and was not reflected in the monthly Current Population Surveys in 2024. Instead, preliminary estimates of NIM, as well as births and deaths, are created at the start of each year by the Census Bureau and are carried forward each month. They are forced to do this because the final population estimates for each year are not released until December. It was in January 2025 that new estimates, with the much higher level of NIM, were finally incorporated into the survey.
28 This can be clearly demonstrated by the 1.6 million increase in the total foreign-born from the December 2024 CPS to the January 2025 CPS. This is far outside any margin of error and represents the impact of the new weights implemented in January of this year, not an actual increase in the foreign-born population of this size.
29 In addition to IRCA, Section 249 of the Immigration and Nationality Act (INA) allows individuals who have lived in the United States since January 1972 to apply for lawful permanent residency under what is often referred to as the “registry provision” of the law. This provision also makes it very unlikely that there are substantial numbers of pre-1980 illegal immigrants in the country.
30 To be sure, not all illegal immigrants come from Latin America, and there are many legal immigrants from that region.
31 While some have argued that more illegal immigrants should be given work authorization, the relatively high rate of employment for new arrivals compared to prior periods when illegal immigrants were a smaller share of newcomers indicates many illegal immigrants are clearly finding jobs.
32 As we show in a recent study, the increase in working-age, U.S.-born men not in the labor force actually began in the 1960s.

