Illegal Population Down Since January
- External Source
admin
- 0
- 28 minutes read

Our analysis of the Bureau of Labor Statistics household survey, officially called the Current Population Survey (CPS), shows a large decline in the foreign-born or immigrant population (legal and illegal) between January and May of this year. The decline was caused by a falloff in the number of non-citizens from Latin America who arrived in 1980 or later, a population that overlaps significantly with illegal immigrants. We preliminarily estimate that the number of illegal immigrants has fallen by one million since the start of the year, perhaps due to their leaving in response to President Trump’s election and stepped-up enforcement efforts. But it is important to note that these findings come with important caveats.
Findings:
- Based on the CPS, published figures from the Bureau of Labor Statistics show that the number of foreign-born individuals in the labor force declined by 601,000 from January to May 2025.
- Our analysis of the raw data shows the total foreign-born population, both in and out of the labor force, declined 957,000 from January to May 2025. This is one of the largest declines over a 4-month period in the foreign-born in the last three decades, but it is not unprecedented.
- The decline was entirely among non-citizens. The number of naturalized U.S. citizens in the data did not fall from January to May of this year.
- In particular, non-citizens from Latin America who indicated they arrived in the United States in 1980 or later show a 1.07 million decrease from January to May of this year and a 1.45 million falloff since December 2024.
- It is well-established that the post-1980 Latin American non-citizen population overlaps significantly with the illegal immigrant population.
- Our preliminary estimate is that there are 14.8 million illegal immigrants in the country in May 2025, one million fewer than we estimated in January of this year.
- There are important caveats about all of these numbers: 1) Though the decline in non-citizens is statistically significant, the decline in the total foreign-born is not. 2) Given recent stepped-up enforcement efforts, it is possible that the decline was due, at least in part, to a greater reluctance by immigrants to participate in the survey or to identify as foreign-born rather than an actual falloff in their numbers. 3) Finally, some of the administrative data necessary to estimate illegal immigrants is not yet available, making our estimate for May only preliminary.
Introduction
Some reporting has focused on the decline of immigrants in the labor market. This analysis goes deeper and uses the public use the Census Bureau’s Current Population Survey, colloquially known as the household survey, to measure recent trends in the foreign-born population in and out of the labor force through May of this year. The foreign-born in Census Bureau surveys includes all persons who were not U.S. citizens at birth – mainly naturalized citizens, lawful permanent residents (green card holders), long-term temporary visitors (e.g. guest workers and foreign students), and illegal immigrants. Both the Census Bureau, which collects the Current Population Survey (CPS), and the Bureau of Labor Statistics, which reports employment trends based on the data, are clear that the survey includes illegal immigrants, though some are missed. We use the terms “immigrant” and “foreign-born” interchangeably in this analysis.1
As the Center has already reported in a prior publication, the foreign-born hit historic highs numerically and as a share of the U.S. population in January 2025 based on the monthly Current Population Survey (CPS). The January CPS was the first government survey to be weighted to reflect the enormous increase in net international migration that the Census Bureau now estimates due to the Biden administration’s border surge.2 The larger American Community Survey (ACS), often used to study immigrants, cannot be used to measure recent trends because it has not been weighted to reflect the Census Bureau’s new migration estimates and only shows the population through July 2023. Using the CPS allows for much more up-to-date analysis.
Findings
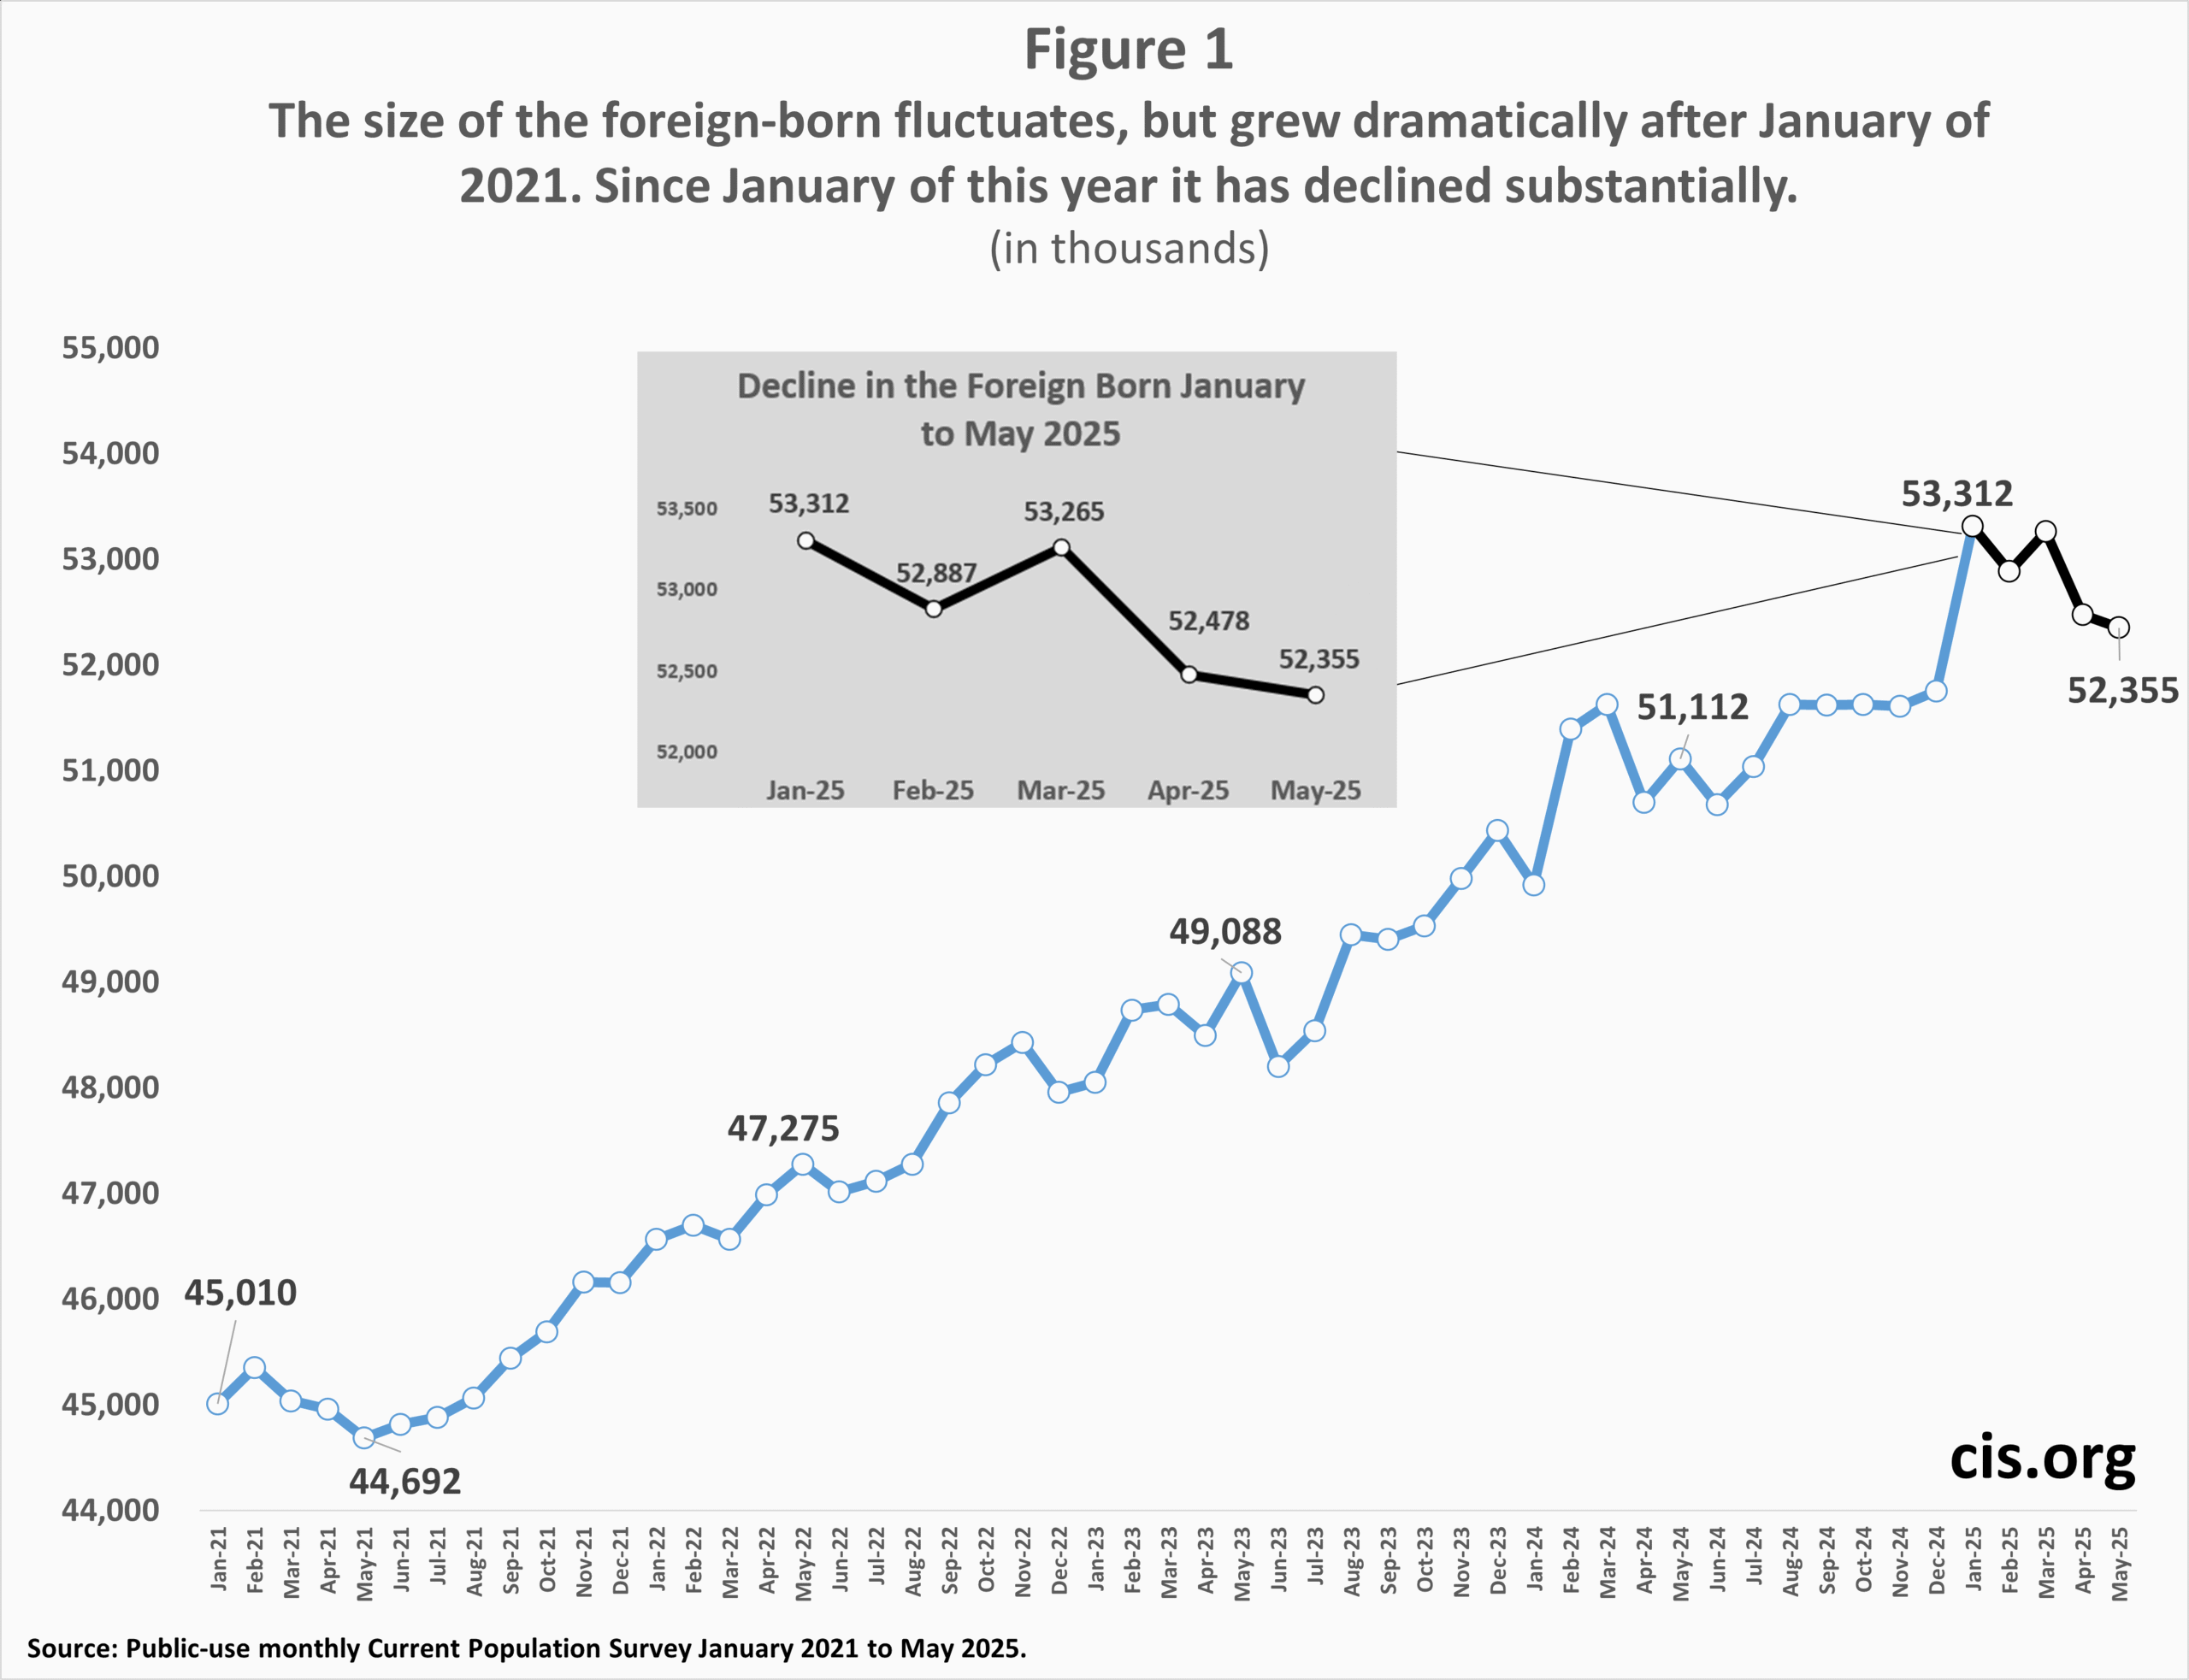
Trends in the Total Foreign-born. Figure 1 reports the total foreign-born population in the United States from January 2021 to May 2025. There is certainly variation in the data, but the trend has been upward in the preceding four years. However, since January 2025 the trend has been in the other direction, declining 957,000 since the start of this year. This is a substantial decline, indicating something fundamental may have changed. Since January of 1994 when the survey began to ask about citizenship, there have only been a few other times when the foreign-born population fell by this much over only a 4-month time period. Variation of this size may represent a real change in the country, or it may reflect the normal sampling error in the data. In fact, although the decline from January to May is large, it is not statistically significant based on the most recent information provided to outside researchers by the Census Bureau for calculating significant changes in the CPS for the foreign-born.3
 |
Decline in Immigrants Responding to the Survey. Like virtually all government and non-government surveys, the CPS is weighted to reflect the size and composition of the total population. The weights are based on Census Bureau estimates of births, deaths, and net international migration. The total population is controlled to certain key demographic variables such as race, sex, age, and Hispanic origin.4 Citizenship and country of birth are not control variables and are allowed to vary based on responses to the survey, as is the case for, say, unemployment or income. The unweighted CPS from January to May of this year shows a decline in the number of foreign-born respondents of 3.7 percent.5 By contrast, in the prior four years, the number of immigrants in the sample had grown every year from January to May. This falloff is another indication that prior trends have reversed.
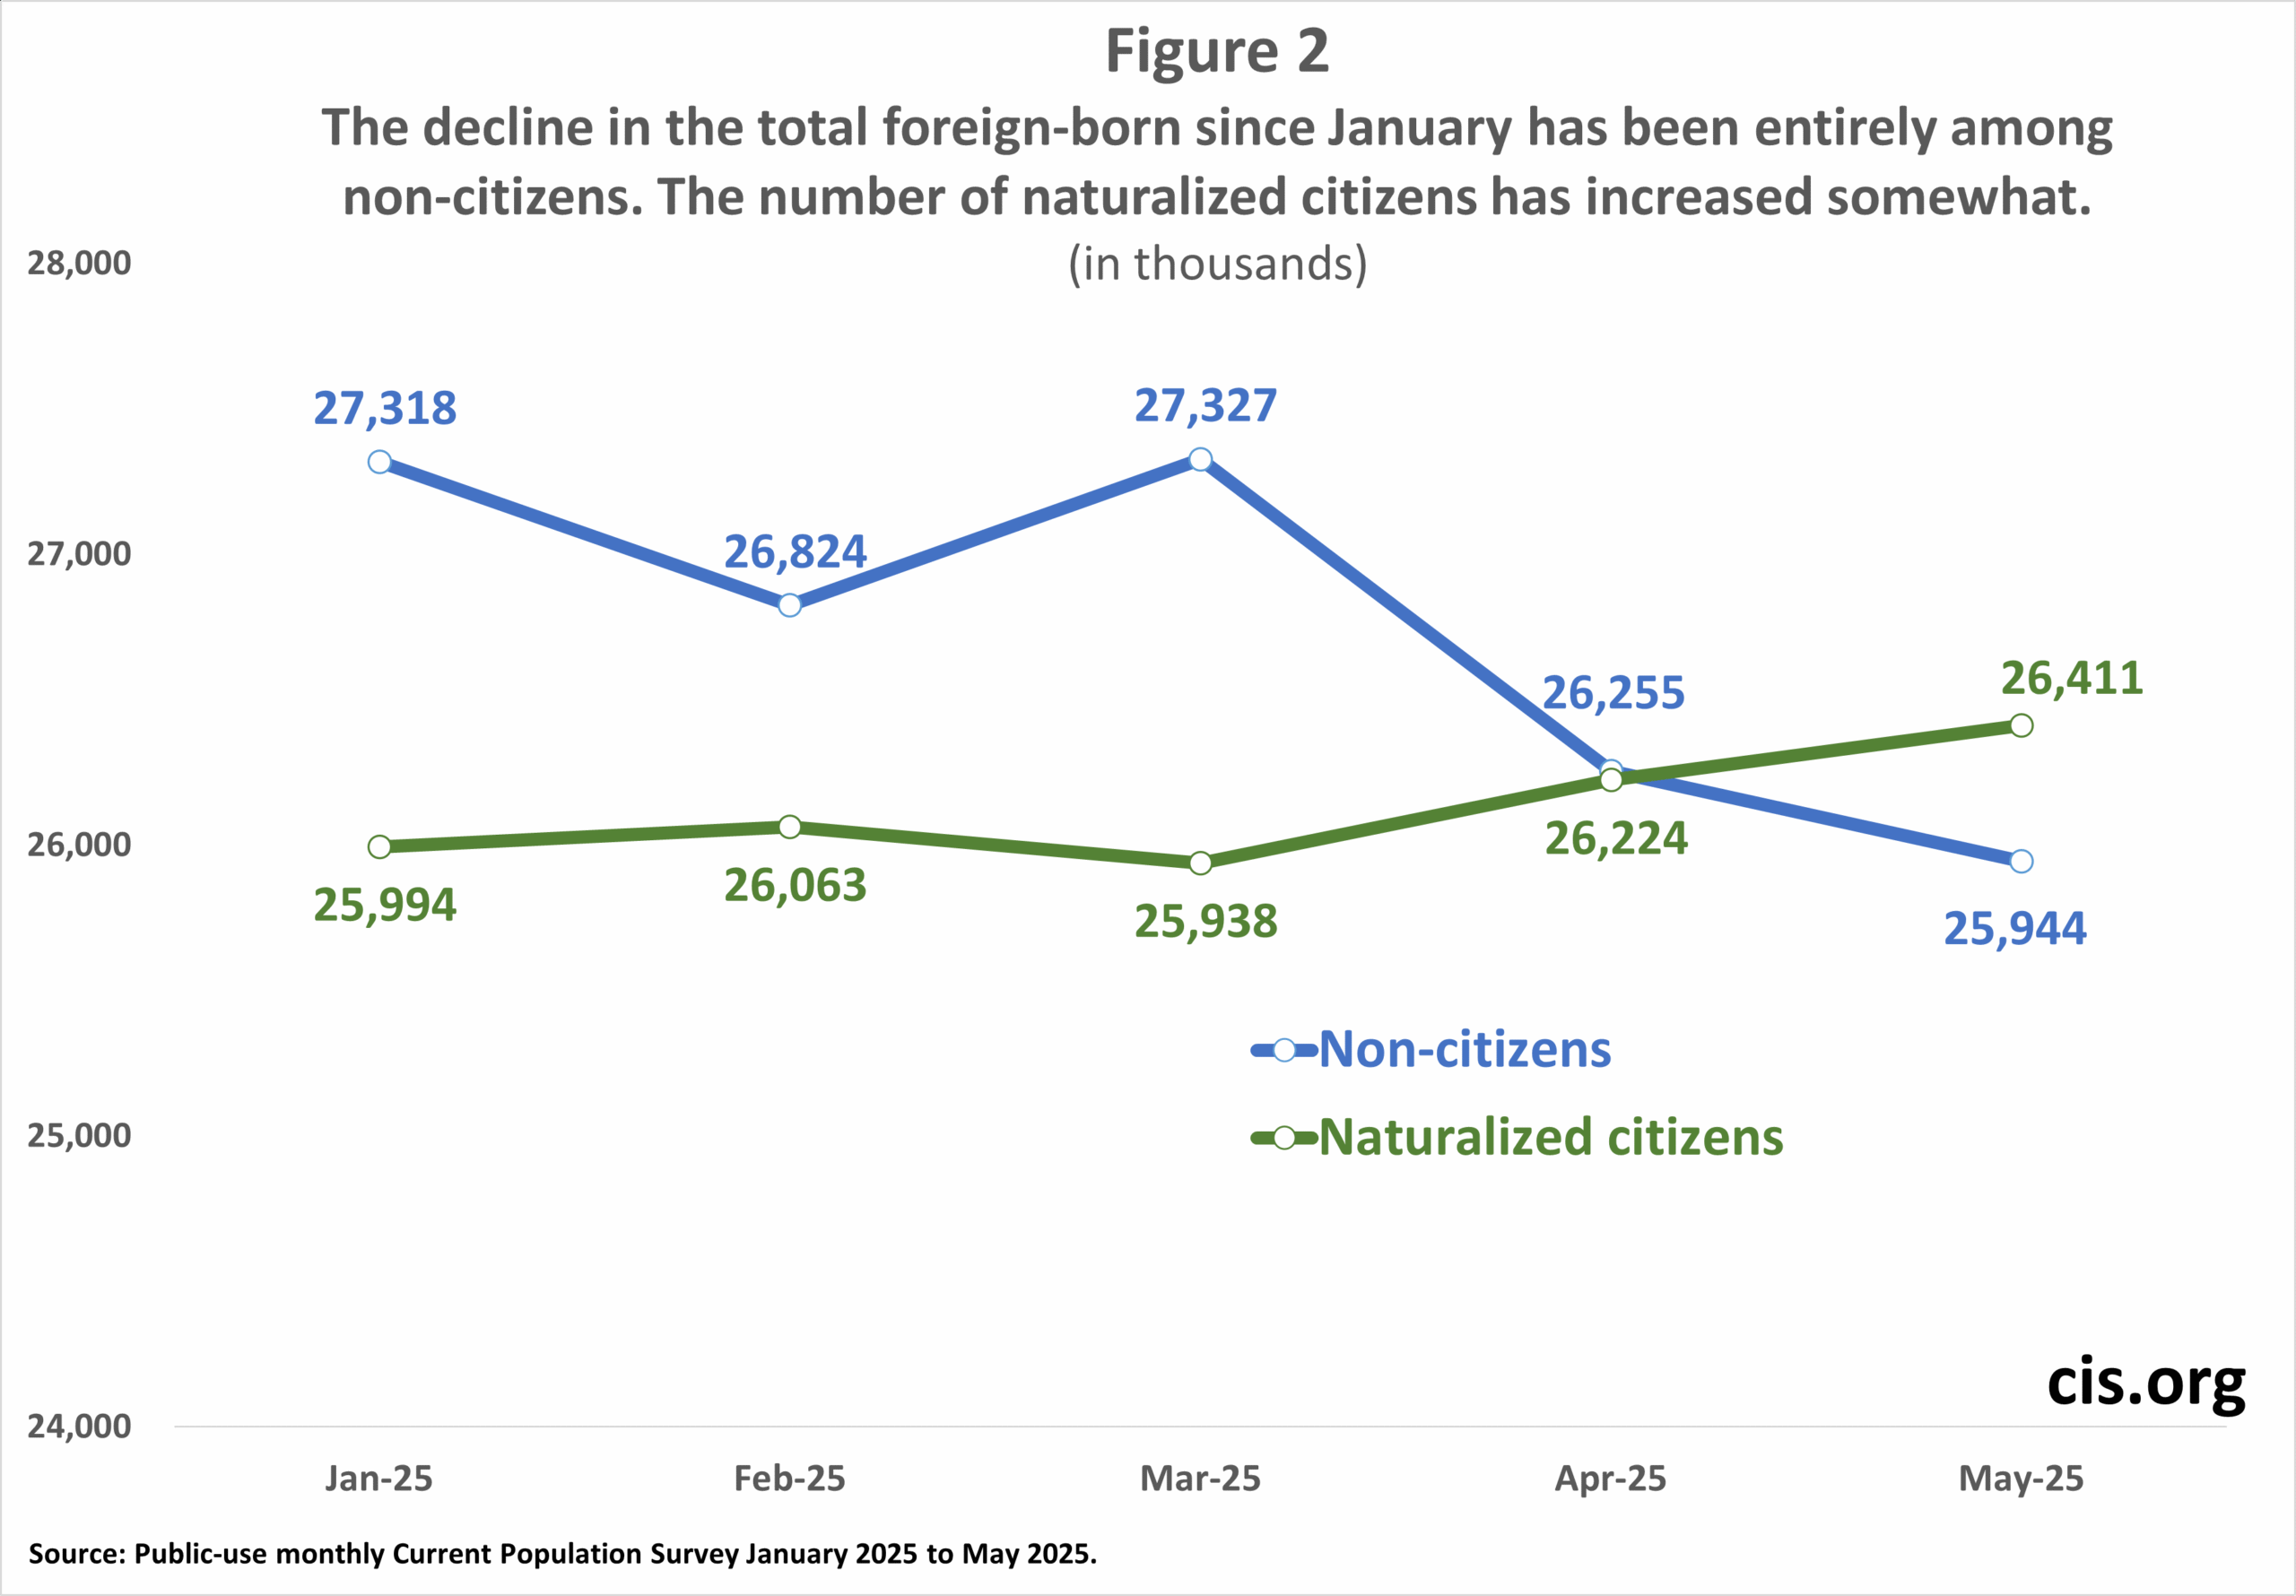
Decline in Non-citizens. Figure 2 shows that the decline in the foreign-born has been entirely among those who are not U.S. citizens. The number of non-citizens is down 1.4 million since January, while the number of naturalized citizens increased by a little over 400,000.6 In FY 2024 about 70,000 lawful permanent residents naturalized per month on average, so the recent increase is not surprising. Since illegal immigrants are not citizens, the decline in the number of people who are not American citizens is consistent with what would be expected if the number of illegal immigrants fell.
 |
Non-citizens from Latin America. Respondents to the CPS are asked when they came to the United States. Illegal immigrants should show up in Census Bureau surveys as having arrived in 1980 or later due to the 1986 IRCA amnesty.7 This is why our estimate of illegal immigrants, and that of DHS, both subtract the legal immigrant population from the total post-1980 foreign-born in Census Bureau data to arrive at the number of illegals.8 As already mentioned, most illegal immigrants should also identify as non-citizens. Also, prior research by DHS, the Pew Research Center, the Center for Migration Studies, and the Migration Policy Institute all indicate that roughly three-fourths of illegal immigrants are from Latin America.9 We also know that 84 percent of those encountered at the nation’s borders from January 2021 to April 2025 are from Latin American countries. As a result, the size of the non-citizen Latin American population who arrived in 1980 or later is highly correlated with the illegal immigrant population.
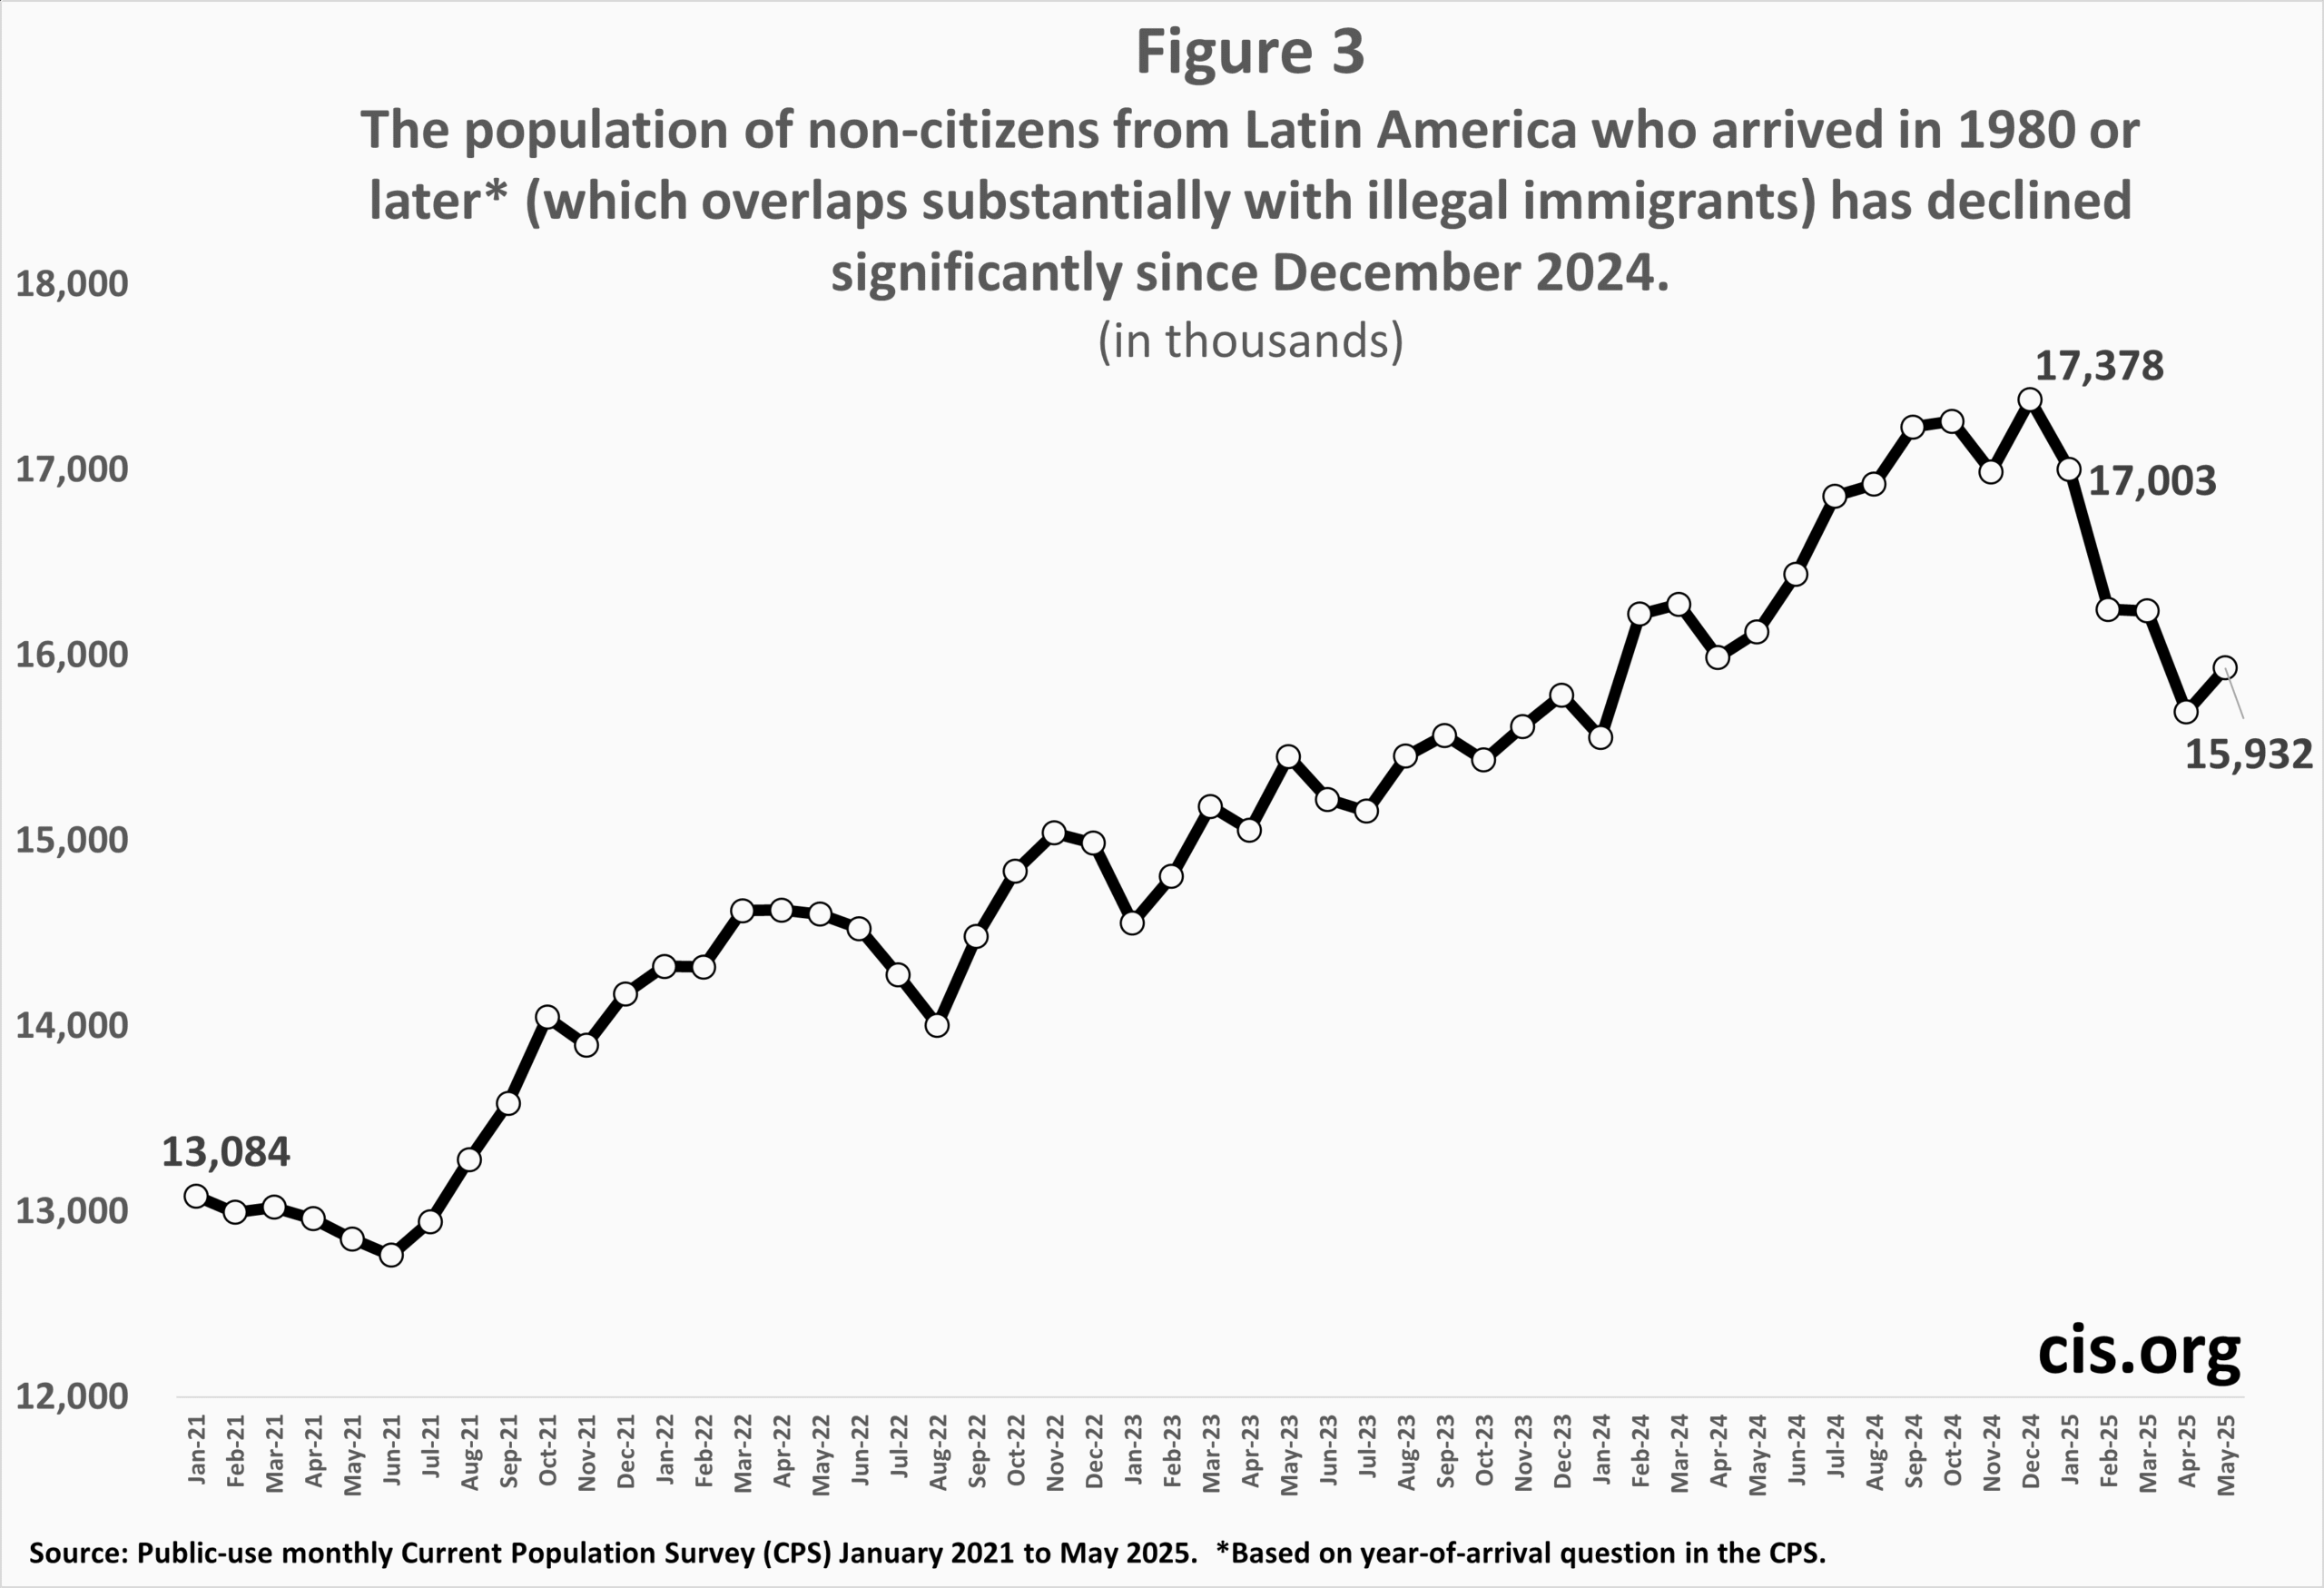
Figure 3 shows this population from January 2021 to May of this year. The number of post-1980 Latin American non-citizens increased relatively steadily from January 2021 to December 2024, which is what we would expect given the border surge and the number of people flown into the country and released under the CHNV program. But from January to May 2025, the number of post-1980 Latin American non-citizens declined by 1.07 million. Unlike the decline in the total foreign-born, the decrease for post-1980 non-citizen Latin Americans is statistically significant at a .99 confidence level.10 The decline from December 2024 to May of this year is even larger at 1.45 million.11 These results strongly support the idea that the election of Donald Trump, his rhetoric, and high-profile enforcement actions as soon as he took office caused a large number of illegal immigrants to leave the country.
 |
Illegal Immigrants. The Center has used the Current Population Survey in the past to estimate the illegal immigrant population in the United States. The survey does not specifically identify illegal immigrants; but like other researchers we use the information in the survey, and other information from outside the survey, to estimate the population living in the country without authorization.12 As we have described in our earlier analysis, we follow DHS’s Office of Homeland Security Statistics approach and first estimate the legal immigrant population that arrived in 1980 or later, allowing for deaths and outmigration, and then subtracting this estimate from the foreign-born population in the survey, specifically those who arrived in 1980 or later.13
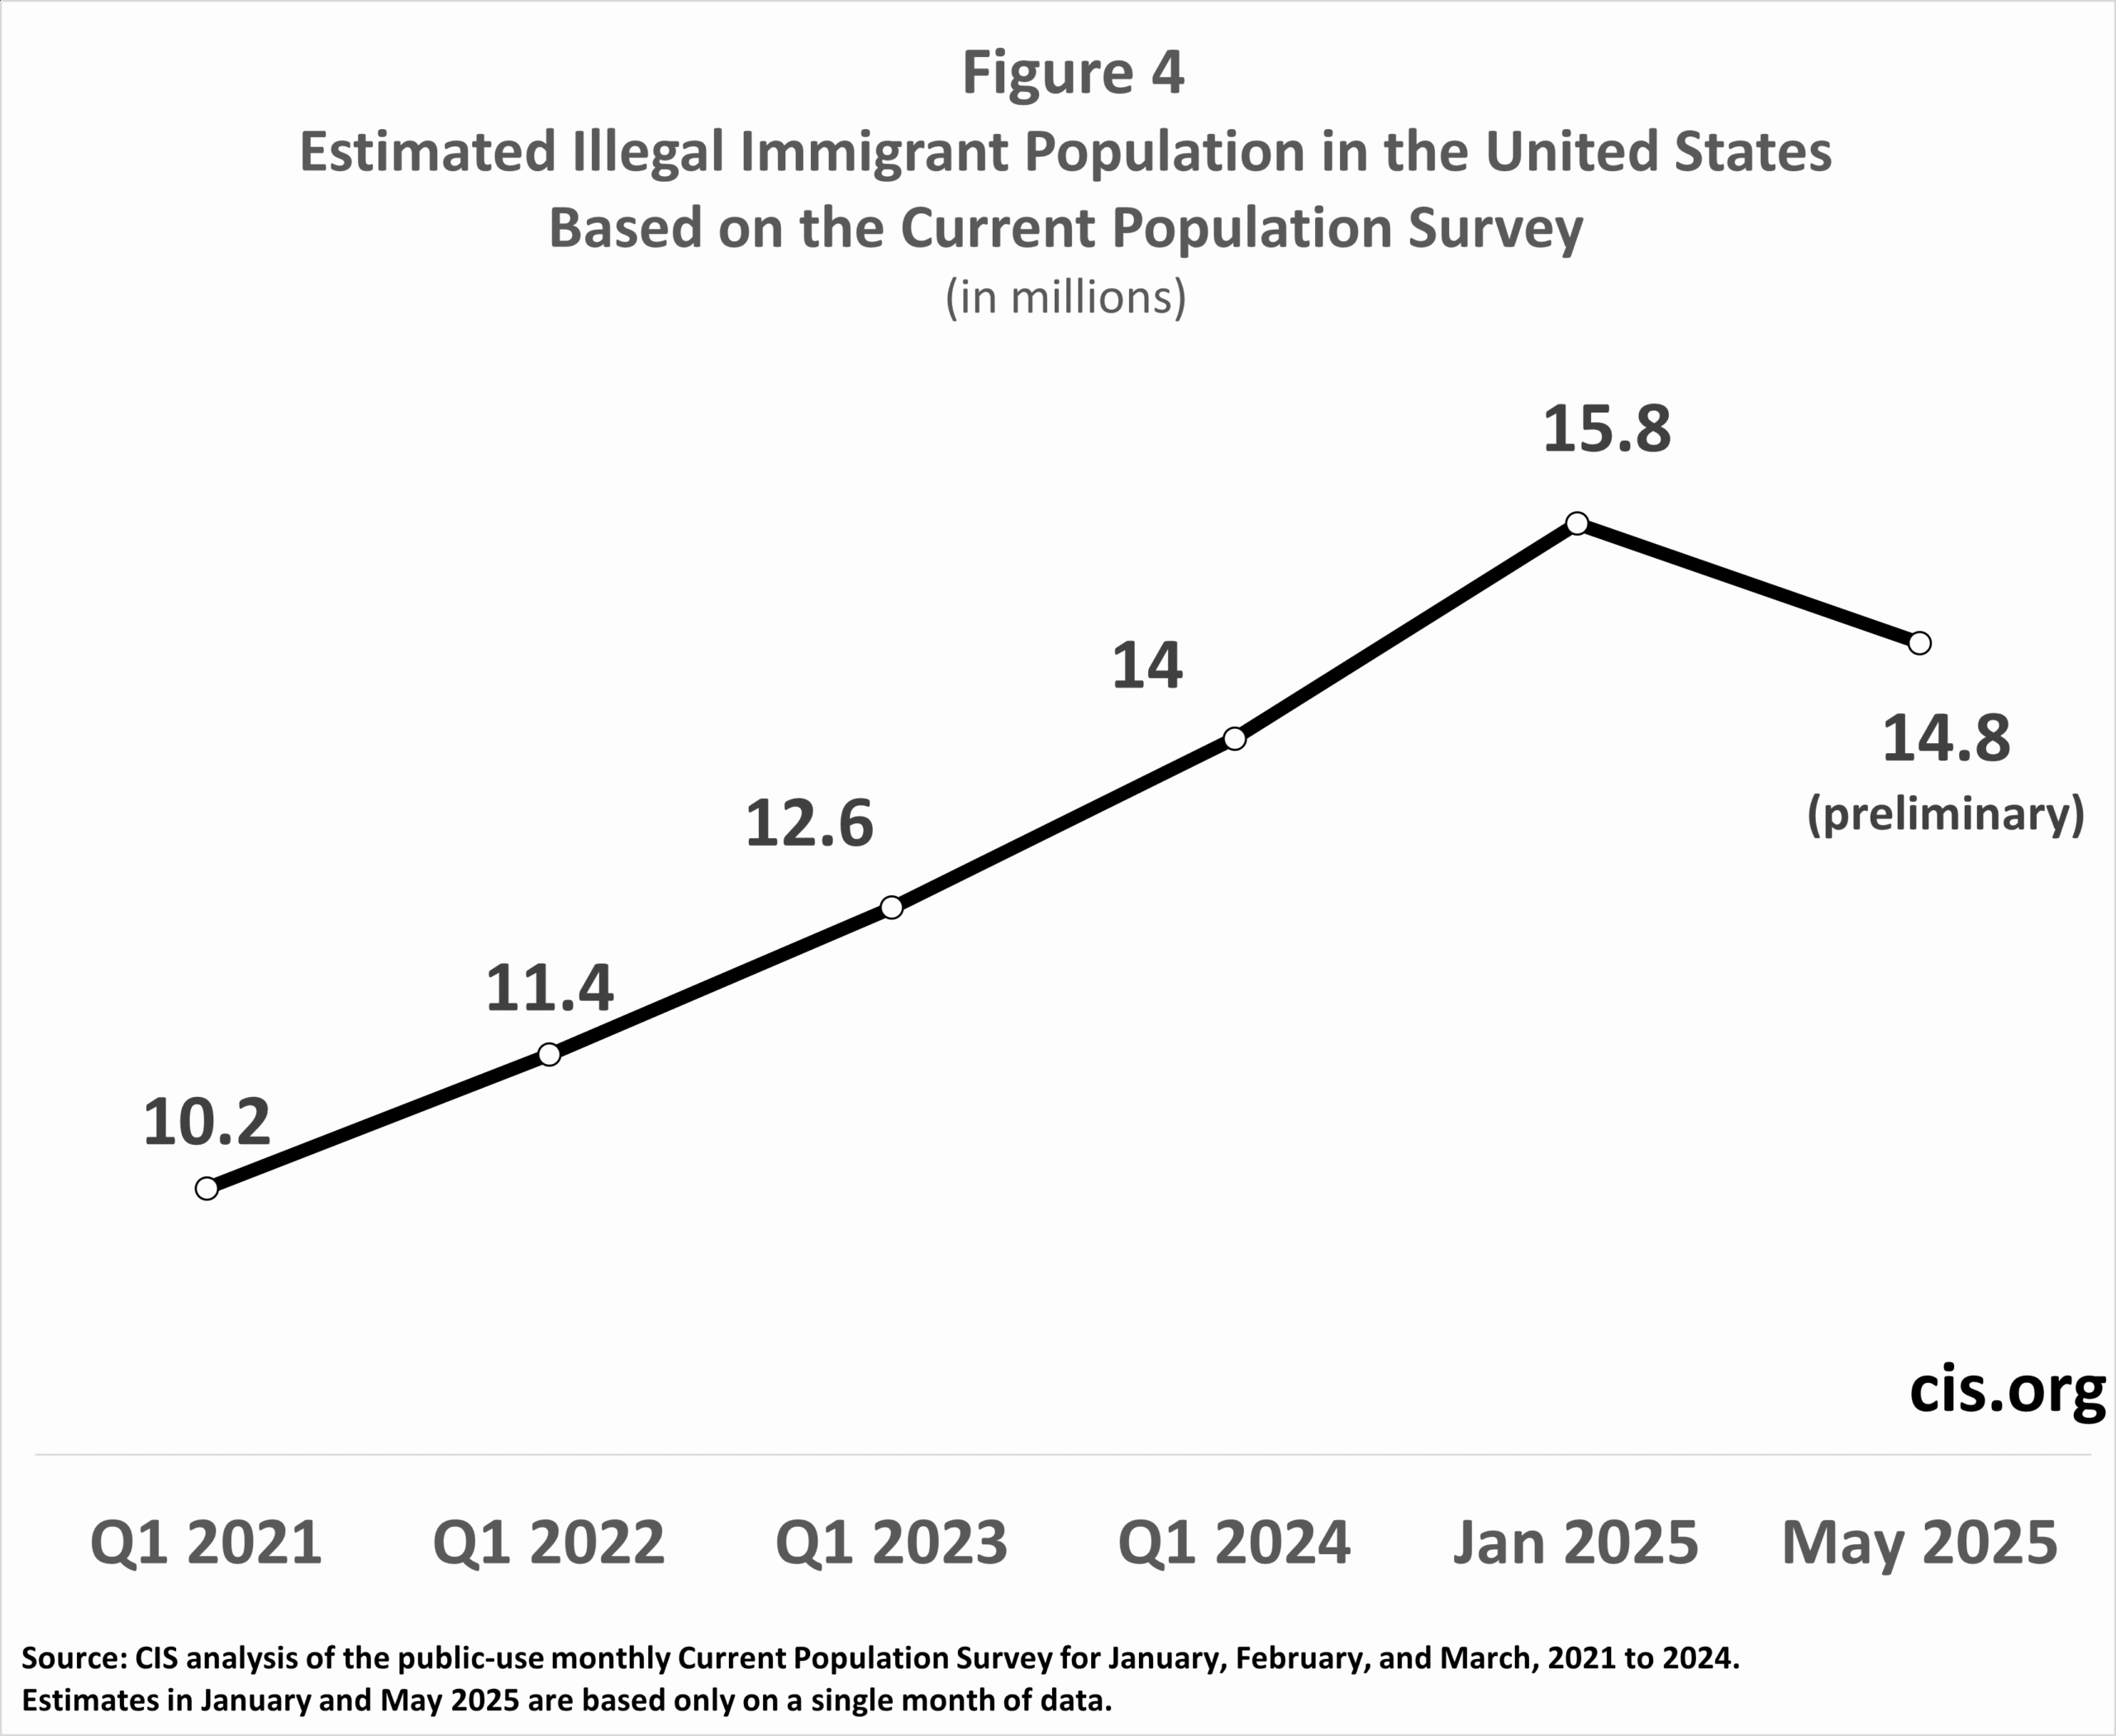
In our report on the January 2025 CPS, we found 46.8 million post-1980 immigrants in the CPS. We further estimated that there were 31.4 million post-1980 legal immigrants in the January 2025 CPS.14 Subtracting the number of legal immigrants from the total post-1980 foreign-born produced an estimate of 15.4 million illegal immigrants in the January survey, which we adjusted up to 15.8 million for undercount. All the administrative data needed to estimate the legal immigrant population in May 2025 is not yet available.15 But based on prior trends and what limited information is available, we preliminarily estimate that the post-1980 legal immigrant population grew to 31.7 million by May of this year. Subtracting this number from the 46.13 million post-1980 immigrants in the CPS produces an estimate of 14.4 million illegal immigrants in the May data. This is one million fewer than our January estimate. If we make the same modest adjustment for undercount as we have done in the past, then the illegal immigrant population in May was 14.8 million or roughly one million fewer than our estimate of 15.8 million for January 2025 (see Figure 4).
 |
Caveats about a Decline in Illegals. There are important caveats about concluding that the illegal population has declined based on the numbers presented here. As we discussed, although the falloff in the non-citizen population overall is statistically significant, as is the decrease for post-1980 non-citizens from Latin America, the overall decline for the foreign-born is not. Another reason for caution is that given recent stepped-up enforcement efforts, it is possible that immigrants, especially illegal immigrants, have become more reluctant to respond to the CPS or if they do respond are less willing to indicate they are foreign-born. This could create the appearance of a decline when it fact none has occurred.16 The 3.7 percent decline in the number of unweighted immigrants in the survey from January to May 2025 could indicate this is happening. However, a decrease in the number of immigrants is also consistent with an actual decline in the foreign-born. Finally, our estimate of illegal immigrants is based on incomplete data for May 2025, increasing uncertainty about our specific estimate of illegal immigrants. All of these factors need to be kept in mind when interpreting the figures presented here.
Conclusion
This analysis shows that the number of foreign-born residents in the country declined by nearly a million in the Current Population Survey from January to May 2025. While this falloff is not statistically significant, we do find statistically significant declines in the number of residents who are not U.S. citizens and the number of non-citizens from Latin America who arrived in the United States in 1980 or later. The post-1980 Latin American non-citizen population in particular overlaps significantly with the illegal immigrant population. Finally, our preliminary estimate of the illegal immigrant population shows a decline of one million from January to May 2025 in the survey.
A large decline in the number of illegal immigrants could be very helpful to less-educated U.S.-born and legal-immigrant workers, whose wages may rise as a result. Further, a tighter labor market and higher wages may help to draw back into jobs the near-record number of working-age American men without a college degree not in the labor force.
We believe there is good evidence the illegal immigrant population has fallen considerably since January. This reverses the trend in the prior four years in which the illegal population grew substantially. However, this conclusion comes with important caveats, stemming directly from the limitations in the available data.
Endnotes
1 The term “immigrant” has a specific meaning in U.S. immigration law, which is all those inspected and admitted as lawful permanent residents (green card holders). In this analysis, we use the term “immigrant” in the non-technical sense to mean all those who were not U.S. citizens at birth.
2 The BLS reports that if the new weights are applied back to the December 2024 CPS, it adds 2.87 million people to the 16-plus population in the United States. The BLS is very clear that the increase in the population was due to the bureau’s new, dramatically higher estimate of migration.
3 Calculating unbiased standard errors and resulting significance tests requires a specific formula provided by the BLS and what are called “parameter estimates” to account for the non-random complex design of the CPS. We use the parameter provided by the BLS for foreign-born individuals ages 16+, as no parameters are provided for the total foreign-born. Comparing the change in the foreign-born population from January to May shows it is not statistically significant.
4 One consequence of this weighting system is that the overall size of the population is fixed at the start of the year and then adjusted upward based on these control variables by the Census Bureau for the Bureau of Labor Statistics. As such, the Hispanic and Asian populations in the data are assumed to grow throughout 2025, partly because the weighting was based on the assumption that the number of immigrants in the country would continue to grow. This is important when measuring the foreign-born because being Asian or Hispanic is correlated with being an immigrant. As a result, the increase in the sample weights for these populations will bias the survey towards showing an increase in the foreign-born. The Hispanic population (immigrant and U.S.-born) in the CPS grew by 435,000 from January to May 2025 and the Asian population grew 197,000. The decline in the foreign-born in the face of this tendency lends support to the idea that the number of immigrants in the country has actually declined.
5 The number of immigrants in the sample fell from 12,708 in January to 12,234 in May. However, the number of native-born respondents fell by 2.6 percent as well. The overall population in the survey does not fall because of the way the data is weighted.
6 The decrease in non-citizens is statistically significant at the 99 percent confidence level.
7 In addition to IRCA, Section 249 of the Immigration and Nationality Act (INA) allows individuals who have lived in the United States since January 1972 to apply for lawful permanent residency under what is often referred to as the “registry provision” of the law. This provision also makes it very unlikely that there are substantial numbers of pre-1980 illegal immigrants in the country.
8 DHS uses the American Community Survey, and its newest estimate of illegal immigrants is only for the beginning of 2022. See Table A1-1 in the DHS estimates of the unauthorized.
9 Countries in Latin American in the CPS include, Belize, Costa Rica, El Salvador, Guatemala, Honduras, Nicaragua, Panama, Cuba, Dominican Republic, Haiti, Jamaica, Bahamas, Barbados, Dominica, Grenada, Trinidad and Tobago, Antigua and Barbuda, St. Kitts-Nevis, St. Lucia, St. Vincent and the Grenadines, Argentina, Bolivia, Brazil, Chile, Colombia, Ecuador, Guyana/British Guiana, Peru, Uruguay, Venezuela, Paraguay, South America not specified, Caribbean not specified, and the Americas not specified.
10 Using the formula and parameter estimates provided by BLS produces a t-test of 4.24 for the change in the post-1980 Latin American non-citizen population between January and May of this year. See endnote 3 for more discussion on statistical significance in the CPS.
11 This decline is all the more surprising because the survey is readjusted every January and the readjustment for 2025 substantially increased the foreign-born, as we discussed in our analysis of the January data. This means that all other things being equal, the size of this population should be lower in December 2024 than in May 2025.
12 Our definition of illegal immigrants includes those with pending defensive asylum applications, those with Deferred Action for Childhood Arrivals (DACA), those with Temporary Protected Status (TPS), and parolees. All of the above individuals are inadmissible aliens under the Immigration and Nationality Act (INA), and the vast majority are subject to removal. However, some researchers might not count most parolees in particular as illegal immigrants.
13 Like DHS, we assume that there should be only a trivial number of illegal immigrants in the country who arrived prior to 1980. See endnote 7 for more information on why this is this case.
14 This includes naturalized citizens, lawful permanent residents, and long-term temporary visitors such as students and guest workers.
15 The key administrative data necessary for updating our prior estimate of the legal immigrant population comes from the State Department’s Bureau of Consular Affairs website at “Monthly Immigrant Visa Issuance Statistics”; the DHS website for the number of adjustment of status reports, the Refugee Processing Center’s website; and the Executive Office for Immigration Review’s Adjudication Statistics. The resident population of long-term temporary visitors is the most difficult to estimate. The government’s most recent estimate of this population is for 2019. Estimating the current number of guestworkers in particular is the most uncertain. The number of foreign students had returned to pre-pandemic levels by the 2023/2024 school year, and we estimate it was slightly larger now based on State Department figures.
16 The fact that there has not been a decline in naturalized citizens or even long-time non-citizens is an indication that the foreign-born in general are still willing to respond and identify as such. The decline is entirely among non-citizens from Latin America who arrived in 1980 or later. Further, respondents are in the survey for four months, out for eight months, and back in for four months, so there is a pre-existing relationship with the Census Bureau for the vast majority of those taking part in the survey in any given month. At least in the short term, this relationship should largely preclude respondents from changing their responses on the citizenship question or any other question, which is one reason the survey is designed this way. The relationship with survey takers should also make respondents more likely to accurately report the presence of foreign-born members of their household.

