The Foreign-Born Population at the State and Regional Level, 1850 to 2025
- External Source
admin
- 0
- 41 minutes read

The foreign-born or immigrant population (legal and illegal together) at the start of 2025 hit a record high, both numerically and as a share of the total U.S. population. This report uses decennial Census data and government surveys to examine the size of the foreign-born population at the regional and state level since 1850, focusing on the growth since 1980. The increases at the sub-national level in many parts of the country in the last 45 years can only be described as extraordinary. Reflecting the border surge, we also examine the large increases in the foreign-born population from the first quarter of 2021 to the first quarter of 2025 in a number of states. The dramatic increase in the foreign-born population is all the more striking because it can grow only from new arrivals — births to immigrants in the United States add only to the native-born — and each year some immigrants already here go home or pass away. But the number of new arrivals has been so high that it dwarfs outmigration and natural mortality.
Among the findings:
- In the first quarter of 2025, the foreign-born share of the population hit historic highs in 14 states: Alabama, Delaware, Florida, Georgia, Indiana, Maryland, Mississippi, New Mexico, North Carolina, Oklahoma, South Carolina, Tennessee, Texas, and Virginia. Numerically, the foreign-born population hit record highs in 31 states plus the District of Columbia.
- Traditionally, the American South received relatively few immigrants, but from 1980 to 2025 the foreign-born population in that region grew an astonishing 578 percent. The foreign-born population since 1980 grew 258 percent in the West, 199 percent in the Midwest, and 141 percent in the Northeast.
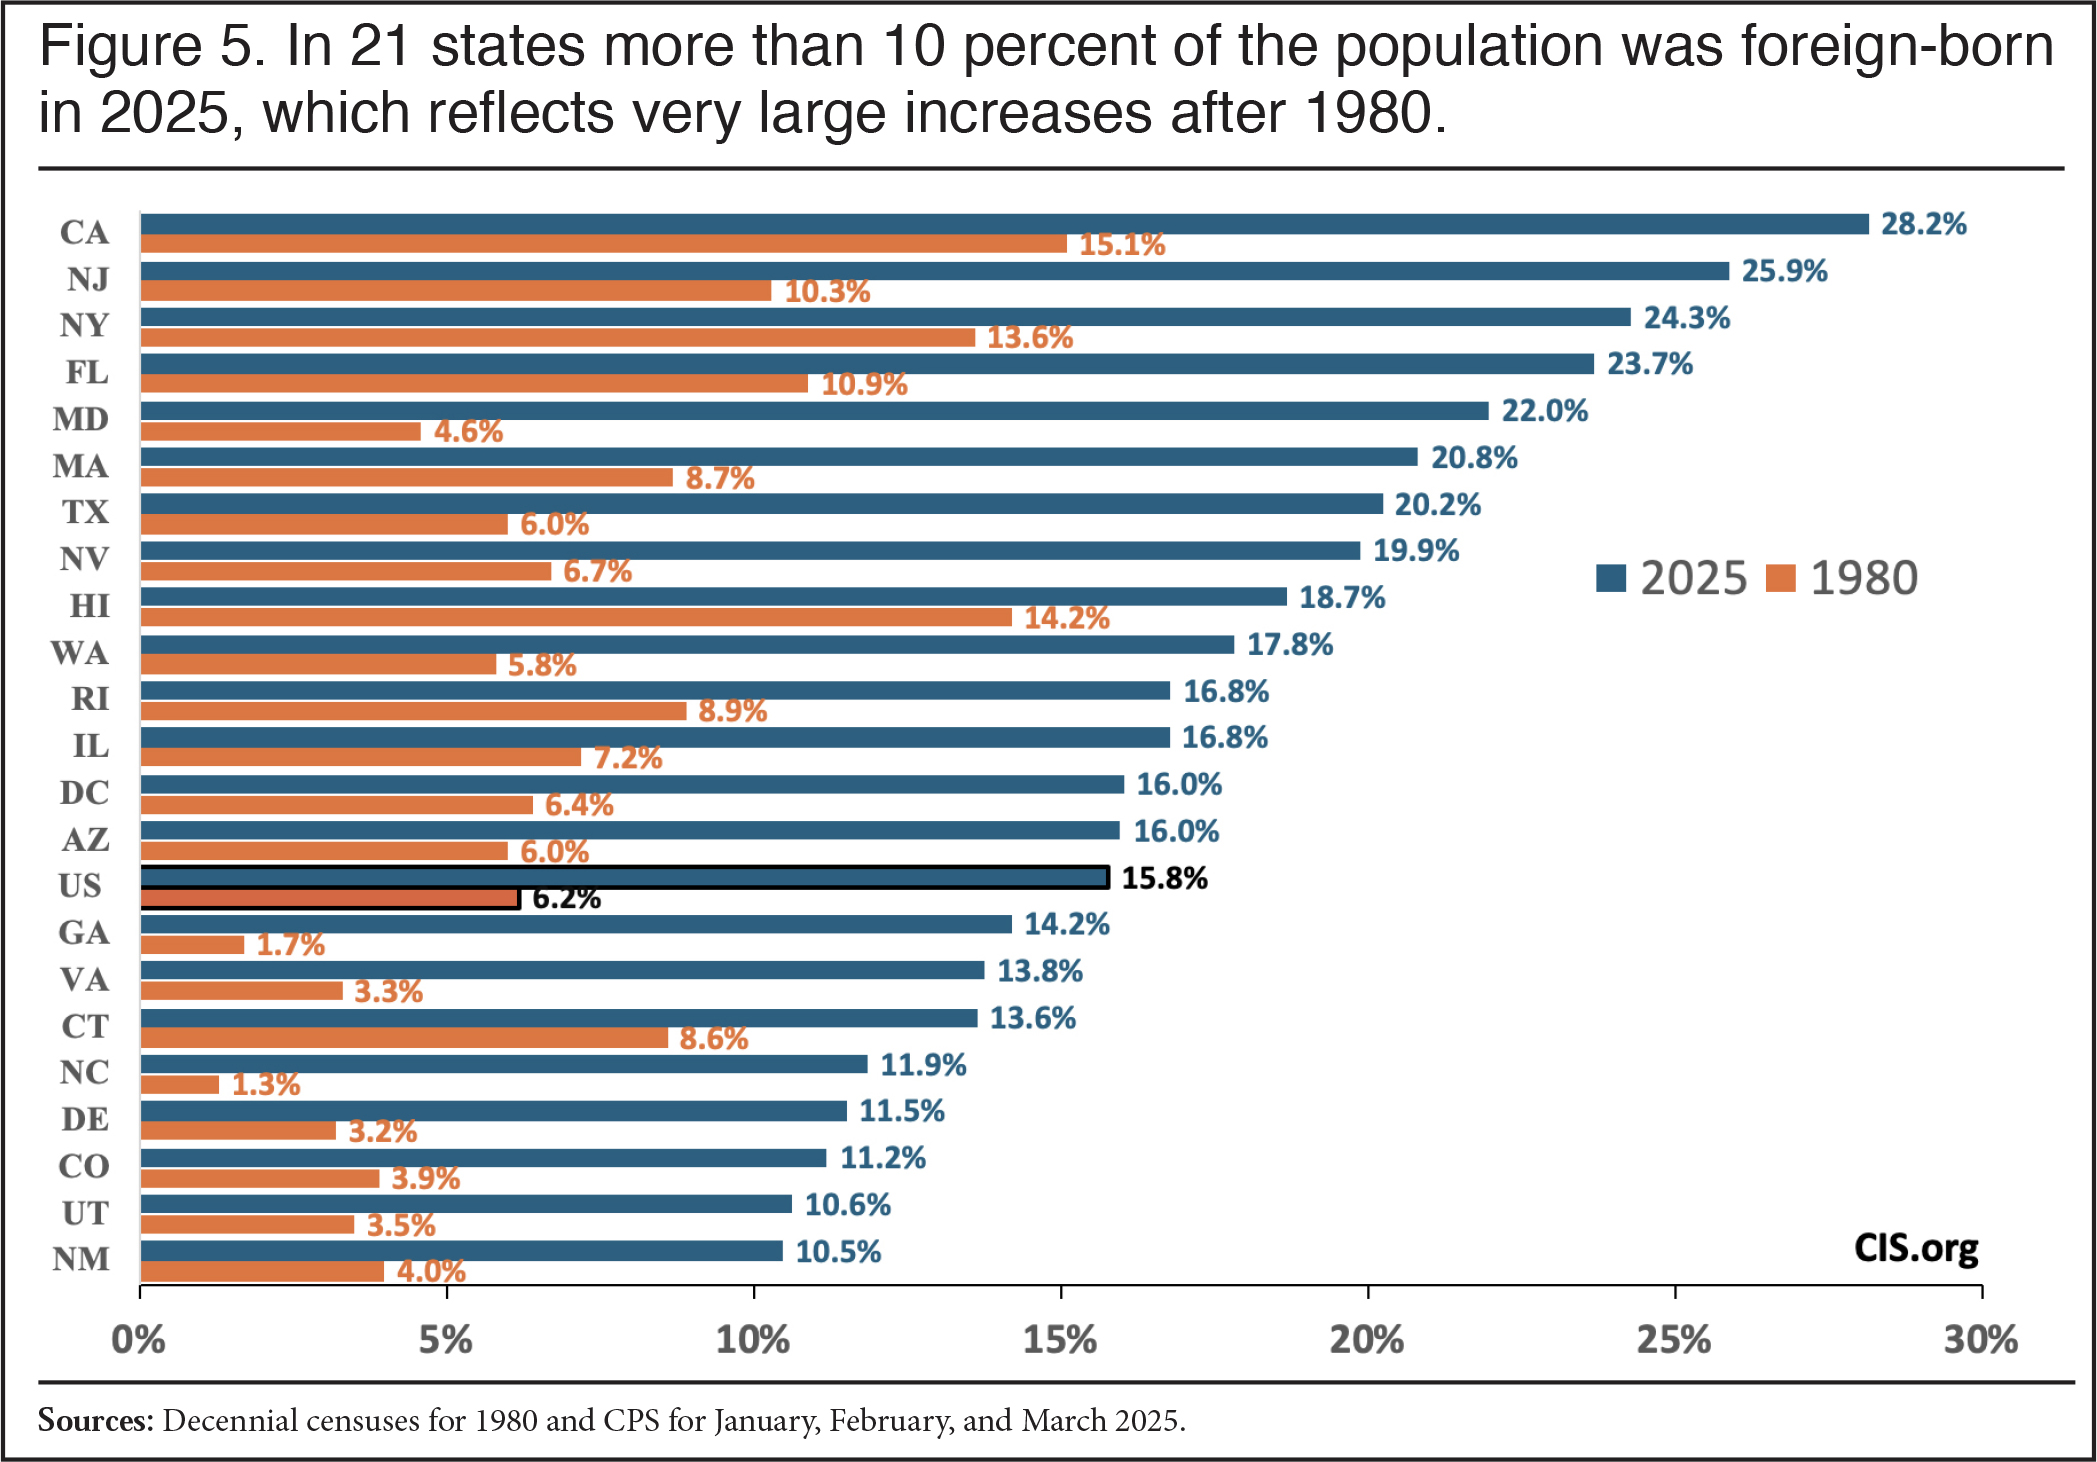
- The enormous increase in immigration can be seen in many individual states. In 1980, the foreign-born were 10 percent or more of the population in only five states. By 2025 this was the case in 21 states plus the District of Columbia.
- In 1980, only three states had more than one million immigrants. By 2025 there were 14 states with over one million foreign-born residents: California, Texas, Florida, New York, New Jersey, Illinois, Georgia, Massachusetts, Washington, Maryland, North Carolina, Pennsylvania, Arizona, and Virginia.
- Since 1980, the size of the foreign-born population has grown by at least 10-fold in four states: Georgia, North Carolina, Nevada, and Tennessee. It increased at least seven-fold in five other states: South Carolina, Arizona, Utah, Texas, and Alabama. In an additional 17 states it increased more than four-fold.
- Nationally, the foreign-born population grew eight times faster than the U.S.-born population, but in 17 states the foreign-born population grew 20 times faster than the U.S.-born population from 1980 to 2025.
- The border surge contributed to very large increases in the number of immigrants in just the last four years in many states. From the first quarter of 2021 to the first quarter of 2025 the foreign-born population grew by more than one-third in 16 states.1
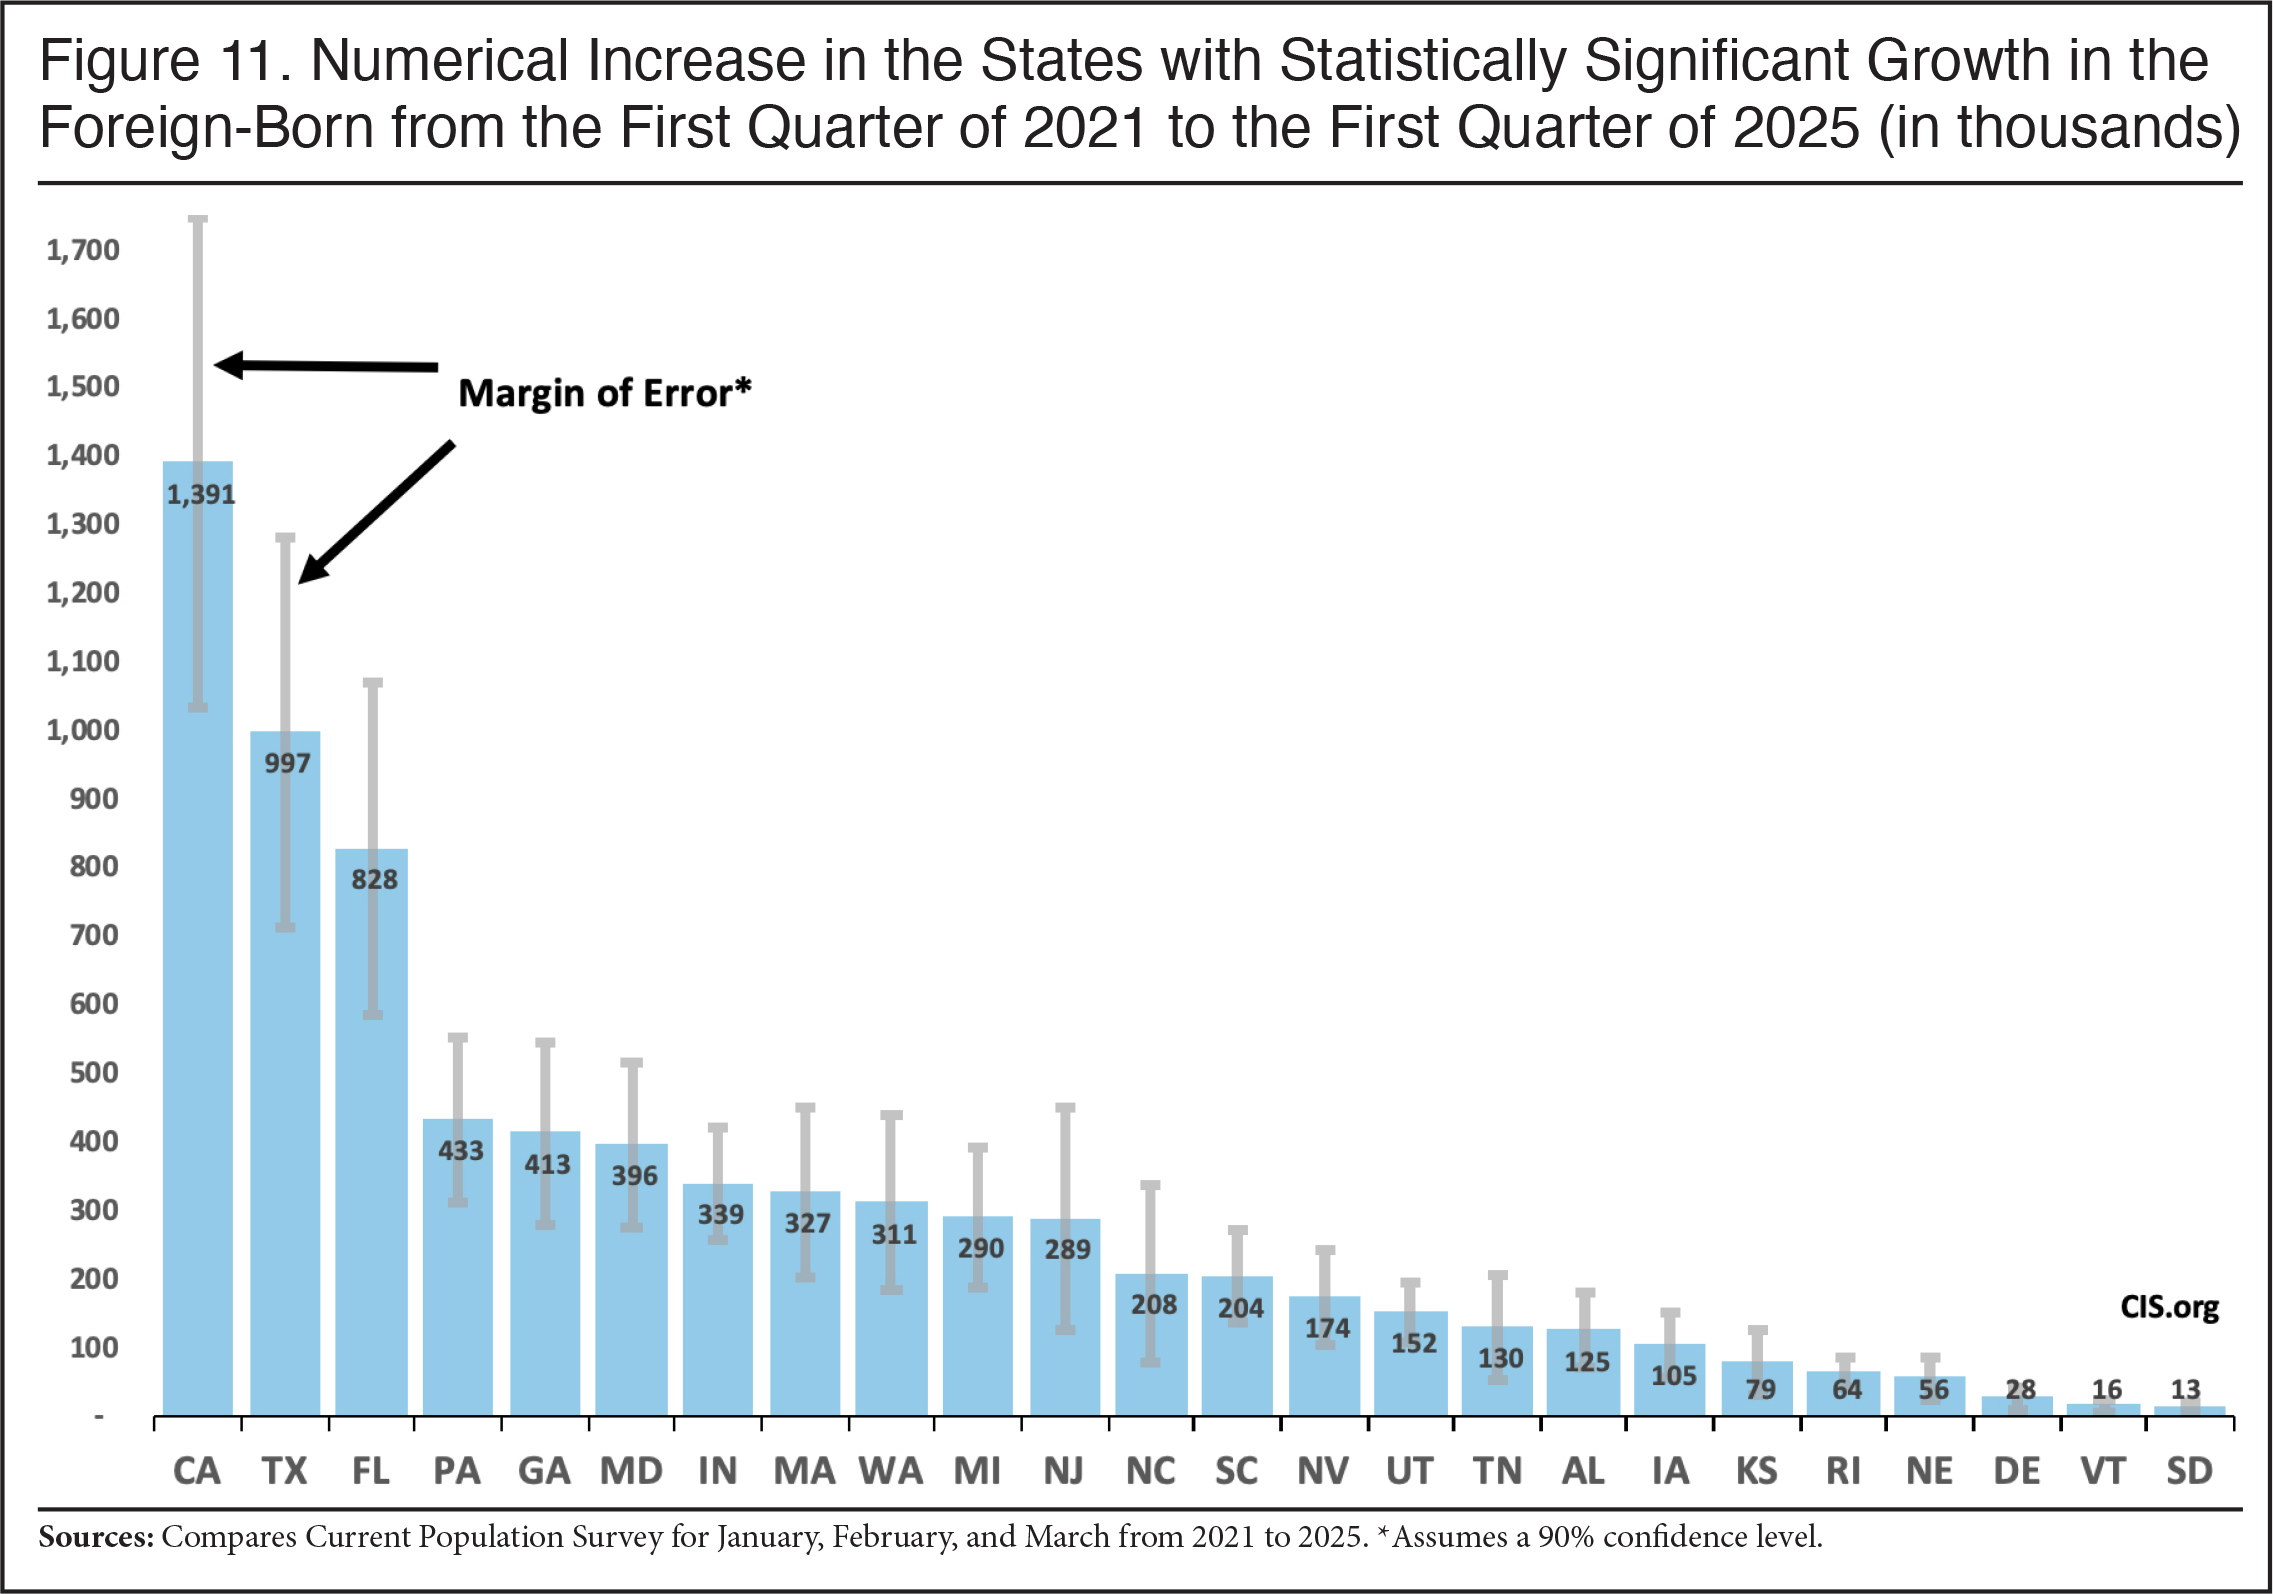
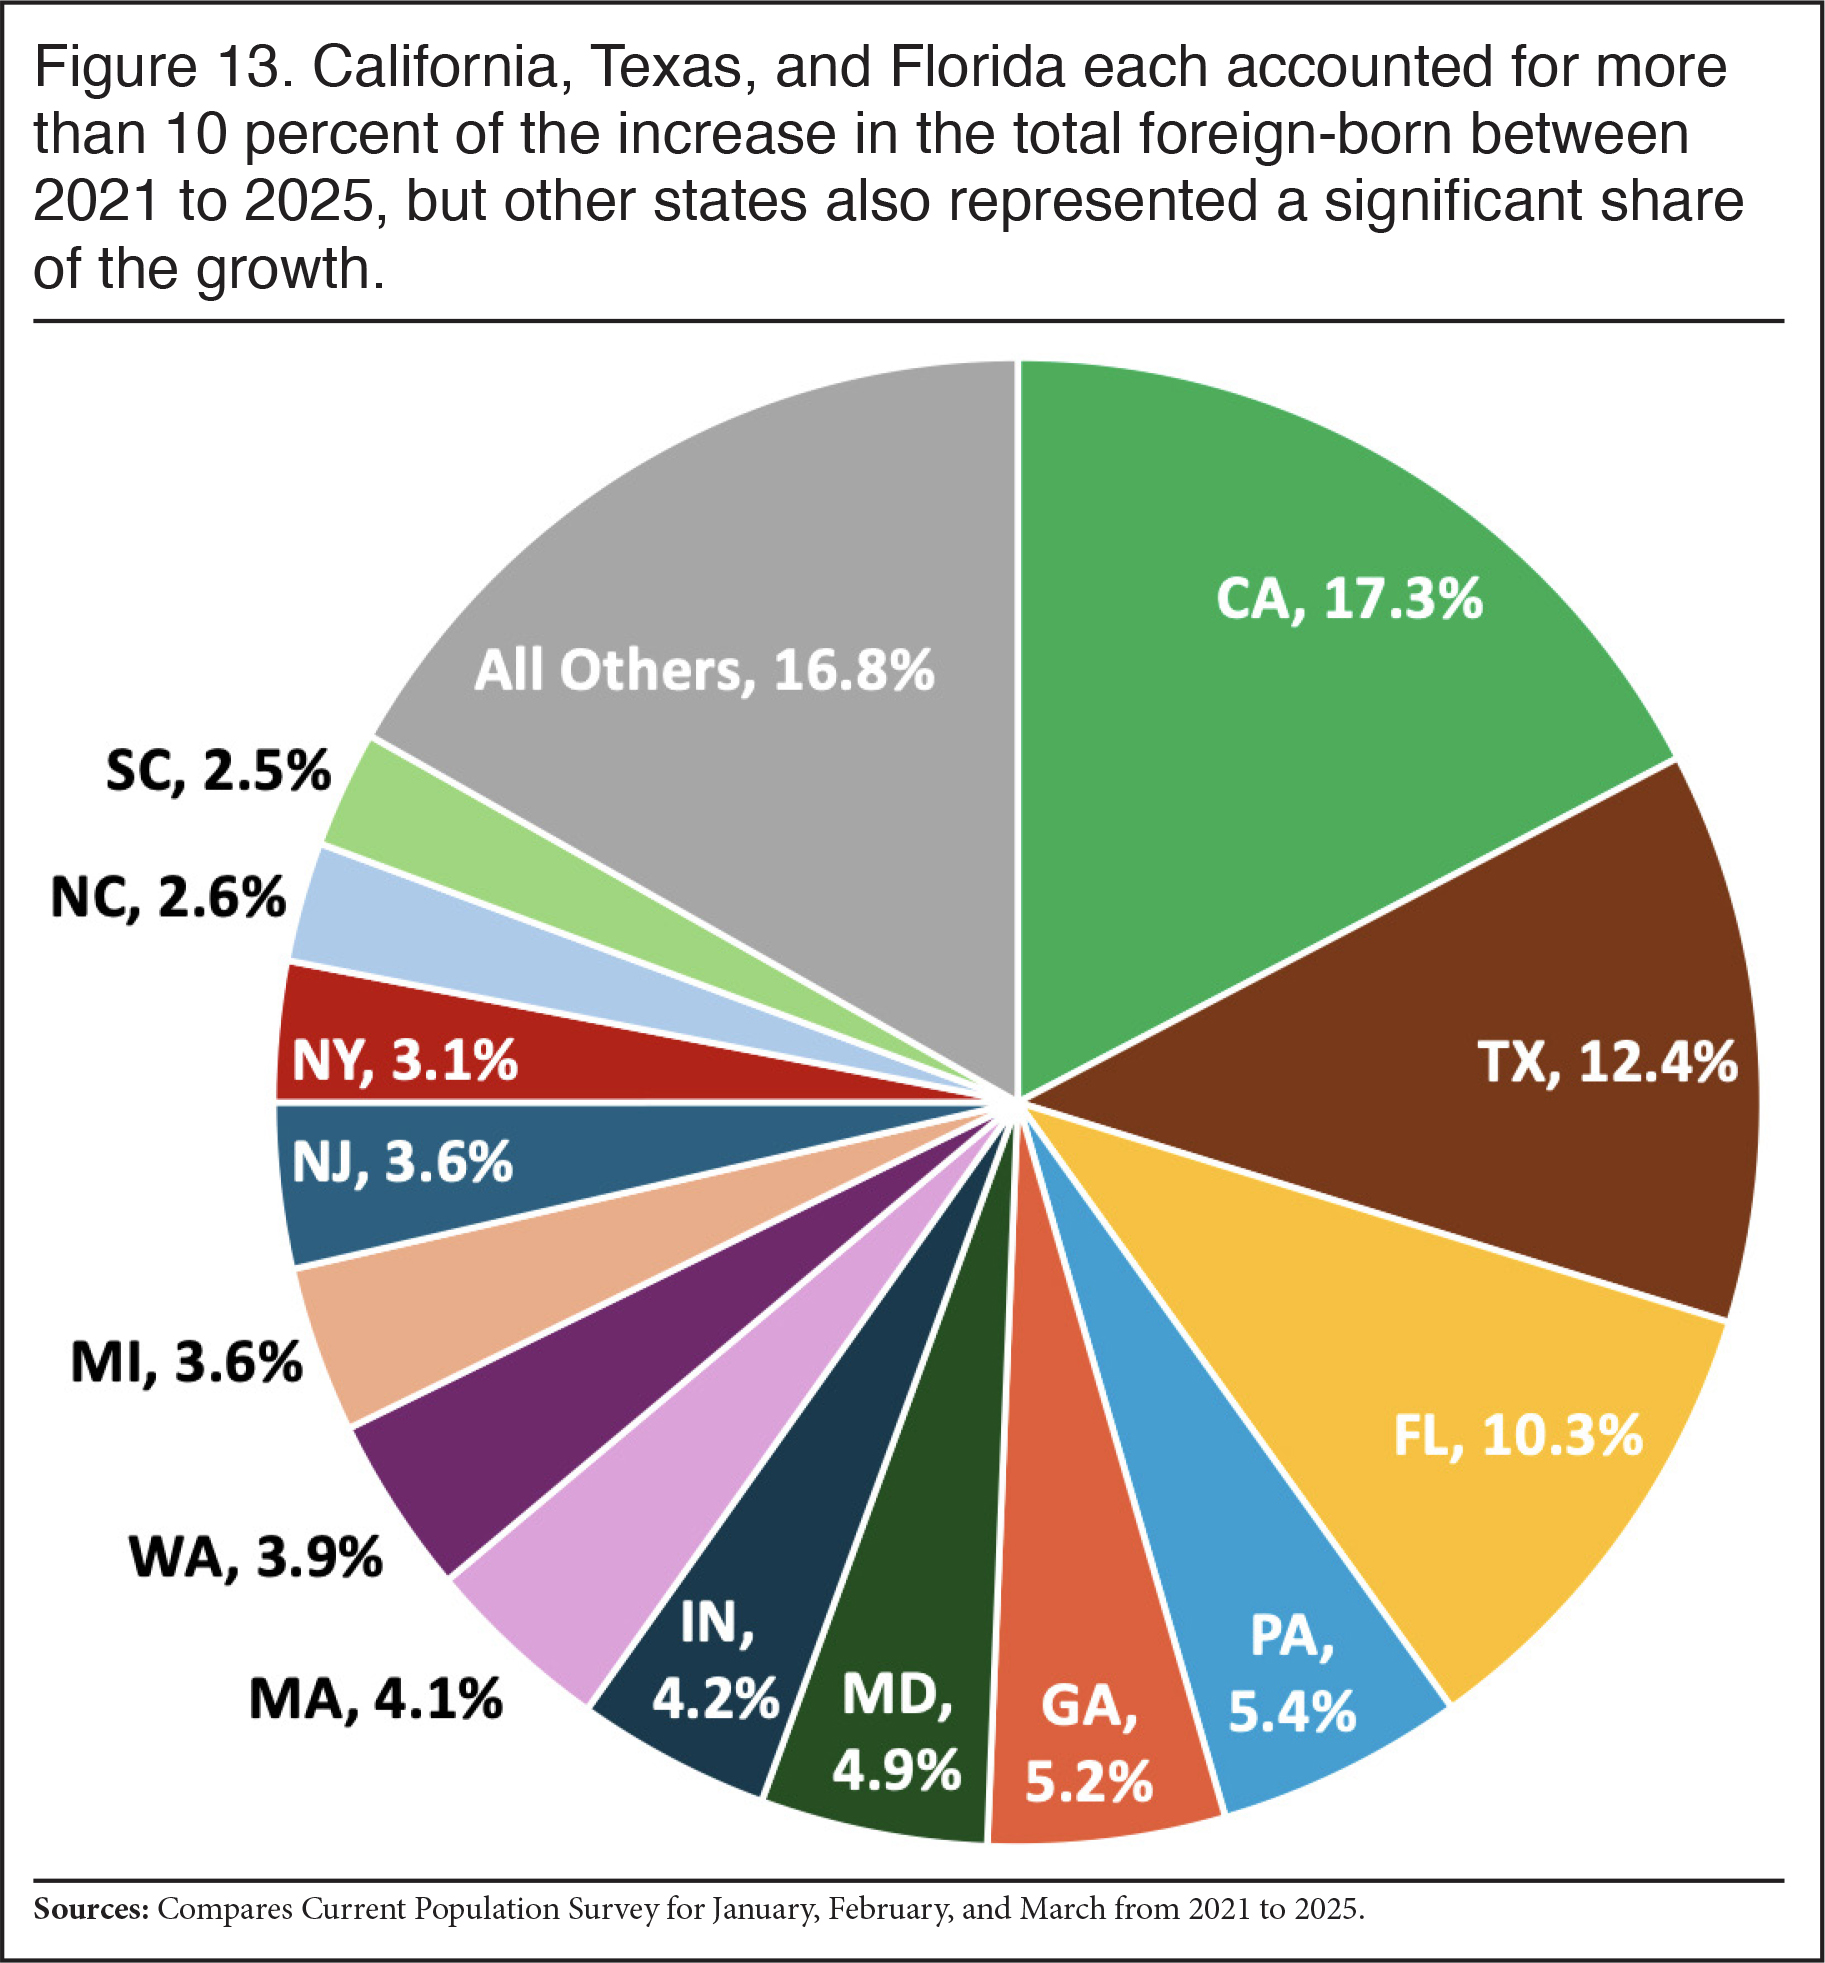
- Numerically the largest increases in the foreign-born population from 2021 to 2025 were in California, up 1.4 million; Texas, up one million; Florida, up 828,000; Pennsylvania, up 433,000; Georgia, up 413,000; Maryland, up 396,000; Indiana, up 339,000; Massachusetts, up 327,000; and Washington, up 311,000.
Introduction
Although we focus on the foreign-born population at the state level since 1980, our analysis provides historical data going back to the 1850 census, which was the first census to fully identify the foreign-born population. As the Center has already reported in a prior publication, the foreign-born population hit record highs in terms of its share of the U.S. population in the first quarter of 2025 both numerically and as a share of the total U.S. population. Excel Tables 1 and 2 provide information going back to 1850 on the size of the foreign-born population in every state and the four main regions of the country. We use the terms “immigrant” and “foreign-born” interchangeably in this report.2 The foreign-born population as defined by the Census Bureau includes all persons who were not U.S. citizens at birth — mainly naturalized citizens and lawful permanent residents, also called green card holders. In the modern period, the foreign-born population in Census Bureau data also includes a substantial number of long-term temporary visitors, such as guest workers and foreign students, as well as illegal immigrants. In the Appendix, we discuss how the collection of data on the foreign-born changed over the last 175 years.
The 2000 decennial census was the last to identify the foreign-born. After 2000, we use the American Community Survey (ACS) in 2010 and 2020 and the monthly Current Population Survey (CPS) for 2025 to measure the foreign-born population.3 The CPS is collected each month by the Census Bureau for the Bureau of Labor Statistics (BLS).4 While the larger ACS is often used to study the foreign-born, the most recent version of the ACS reflects only the population through July 2023 and is now two years out of date. Further, as we discuss in a prior publication, the ACS has not yet been weighted to reflect the enormous increase in migration that the Census Bureau now estimates in its newest population estimates. In contrast, the CPS starting in January 2025 is the first government survey to be weighted based on these new estimates of migration and therefore should better reflect the surge in immigration that occurred during the Biden administration.5 We use a combined three-month sample (January, February, and March) of the CPS in order to obtain more statistically robust estimates of the foreign-born population at the state level.6
Findings
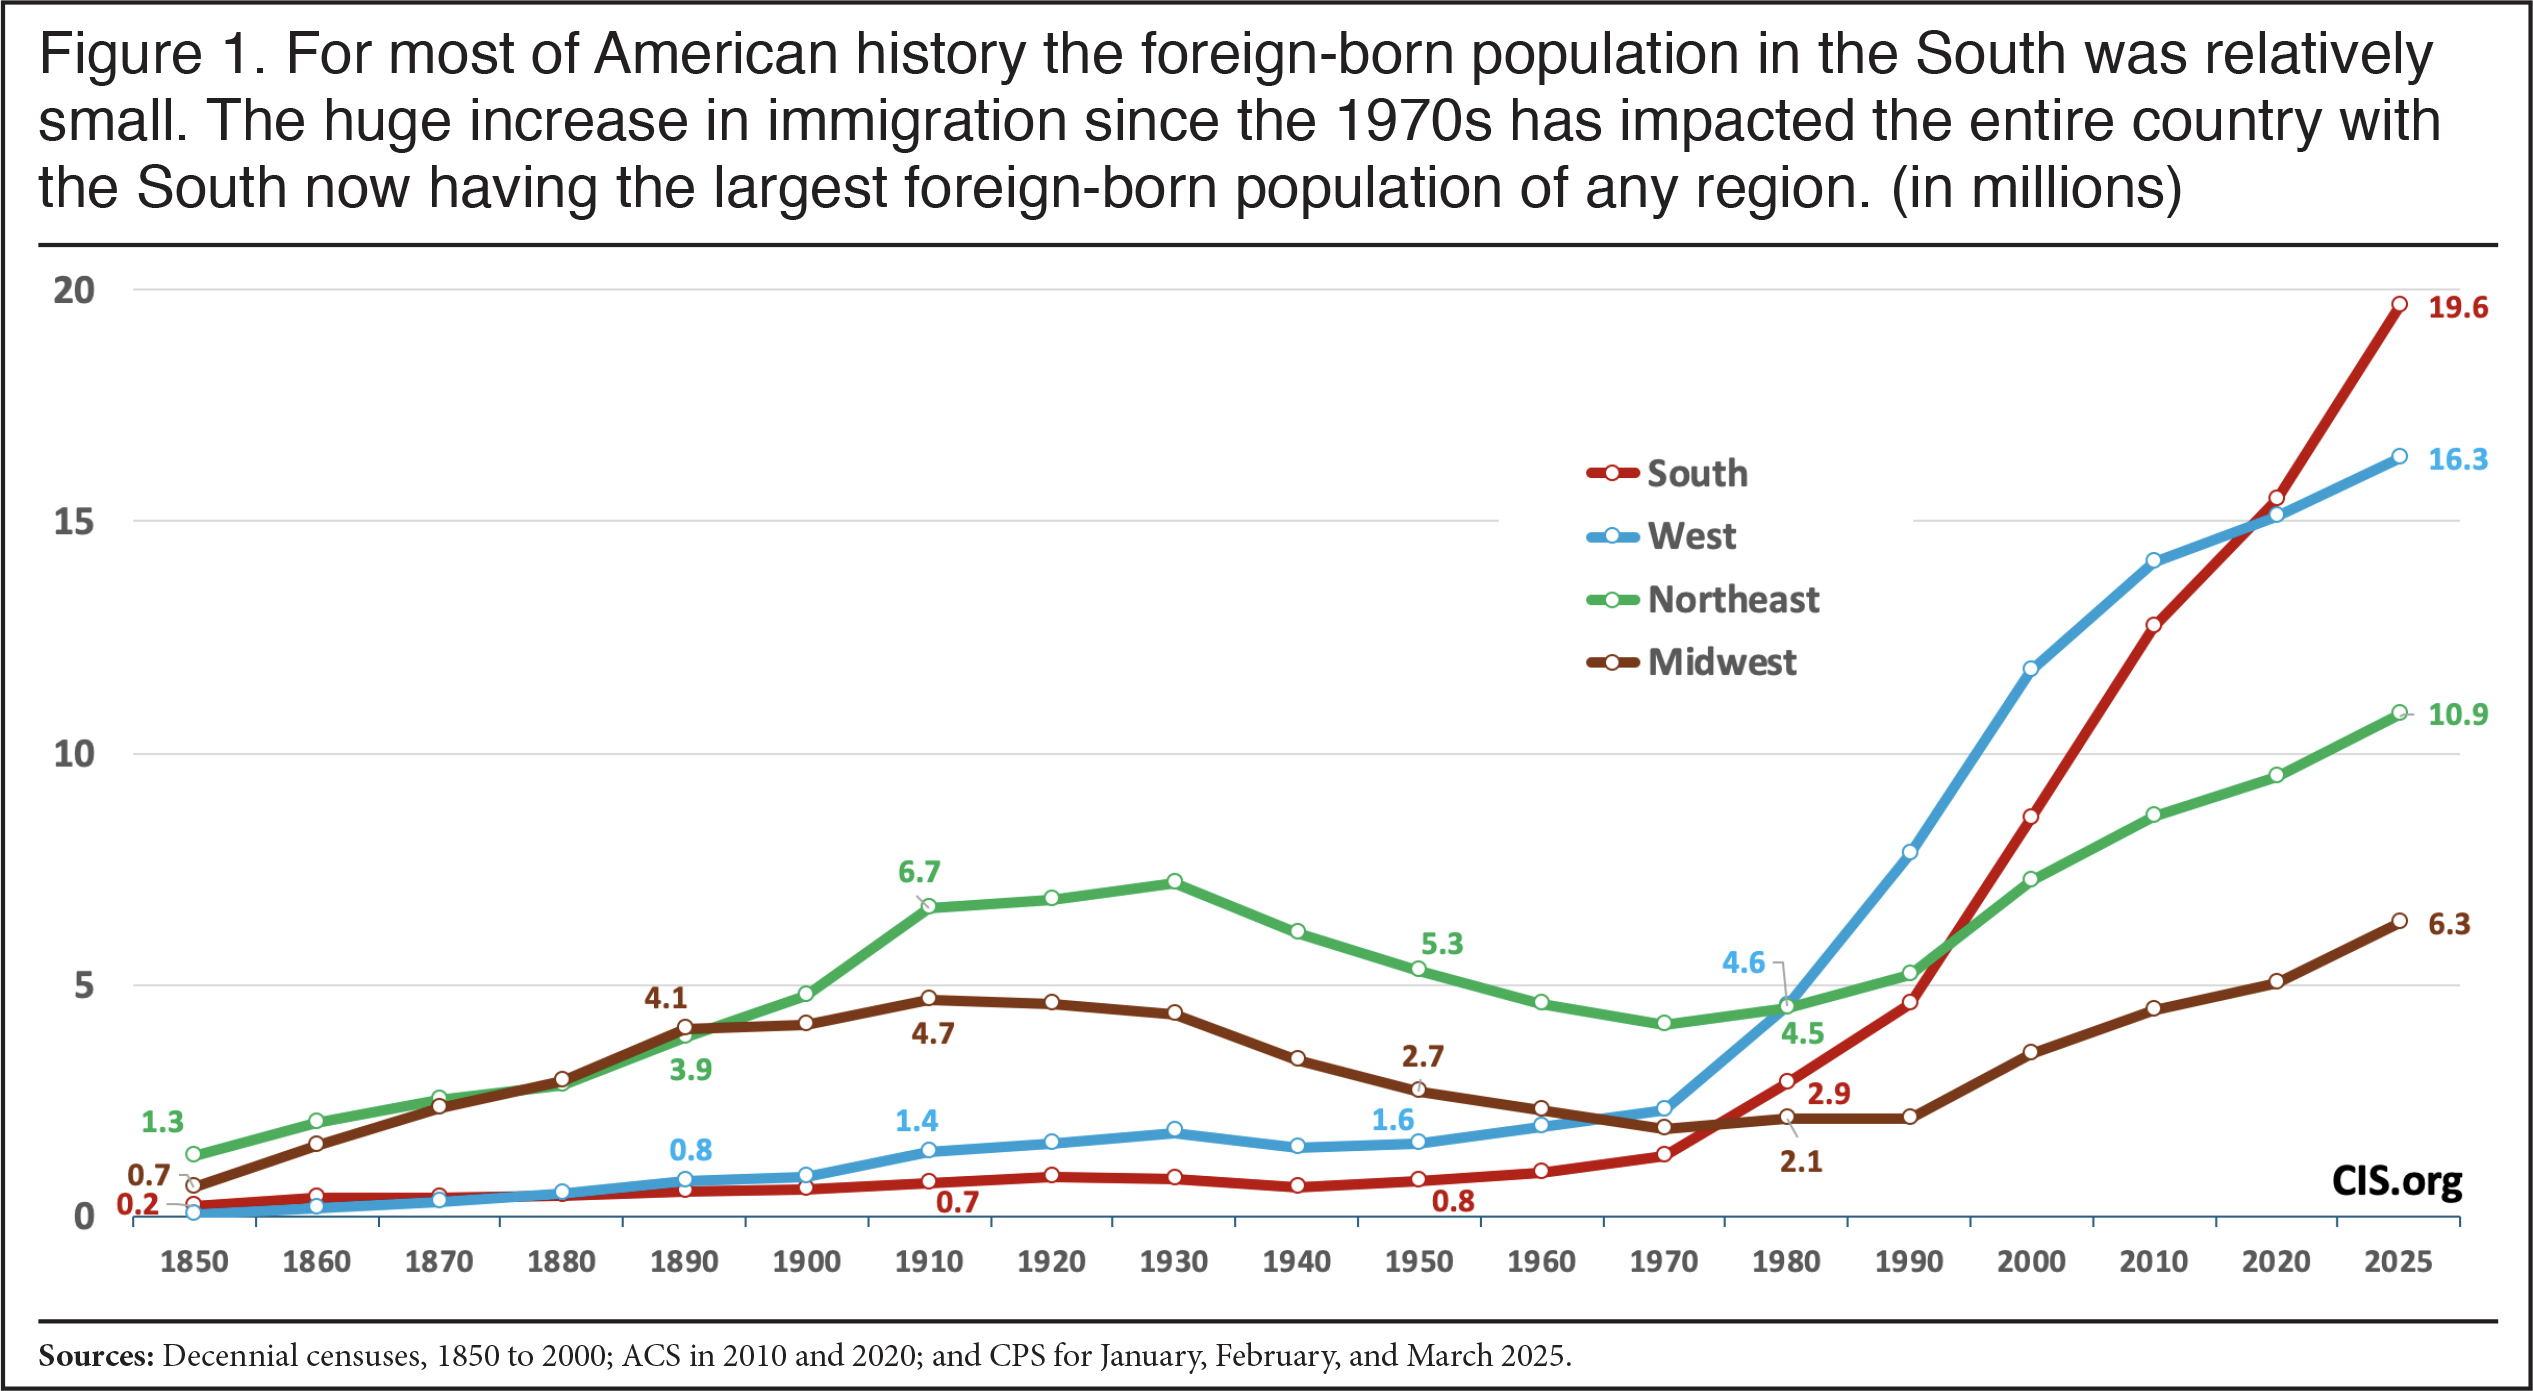
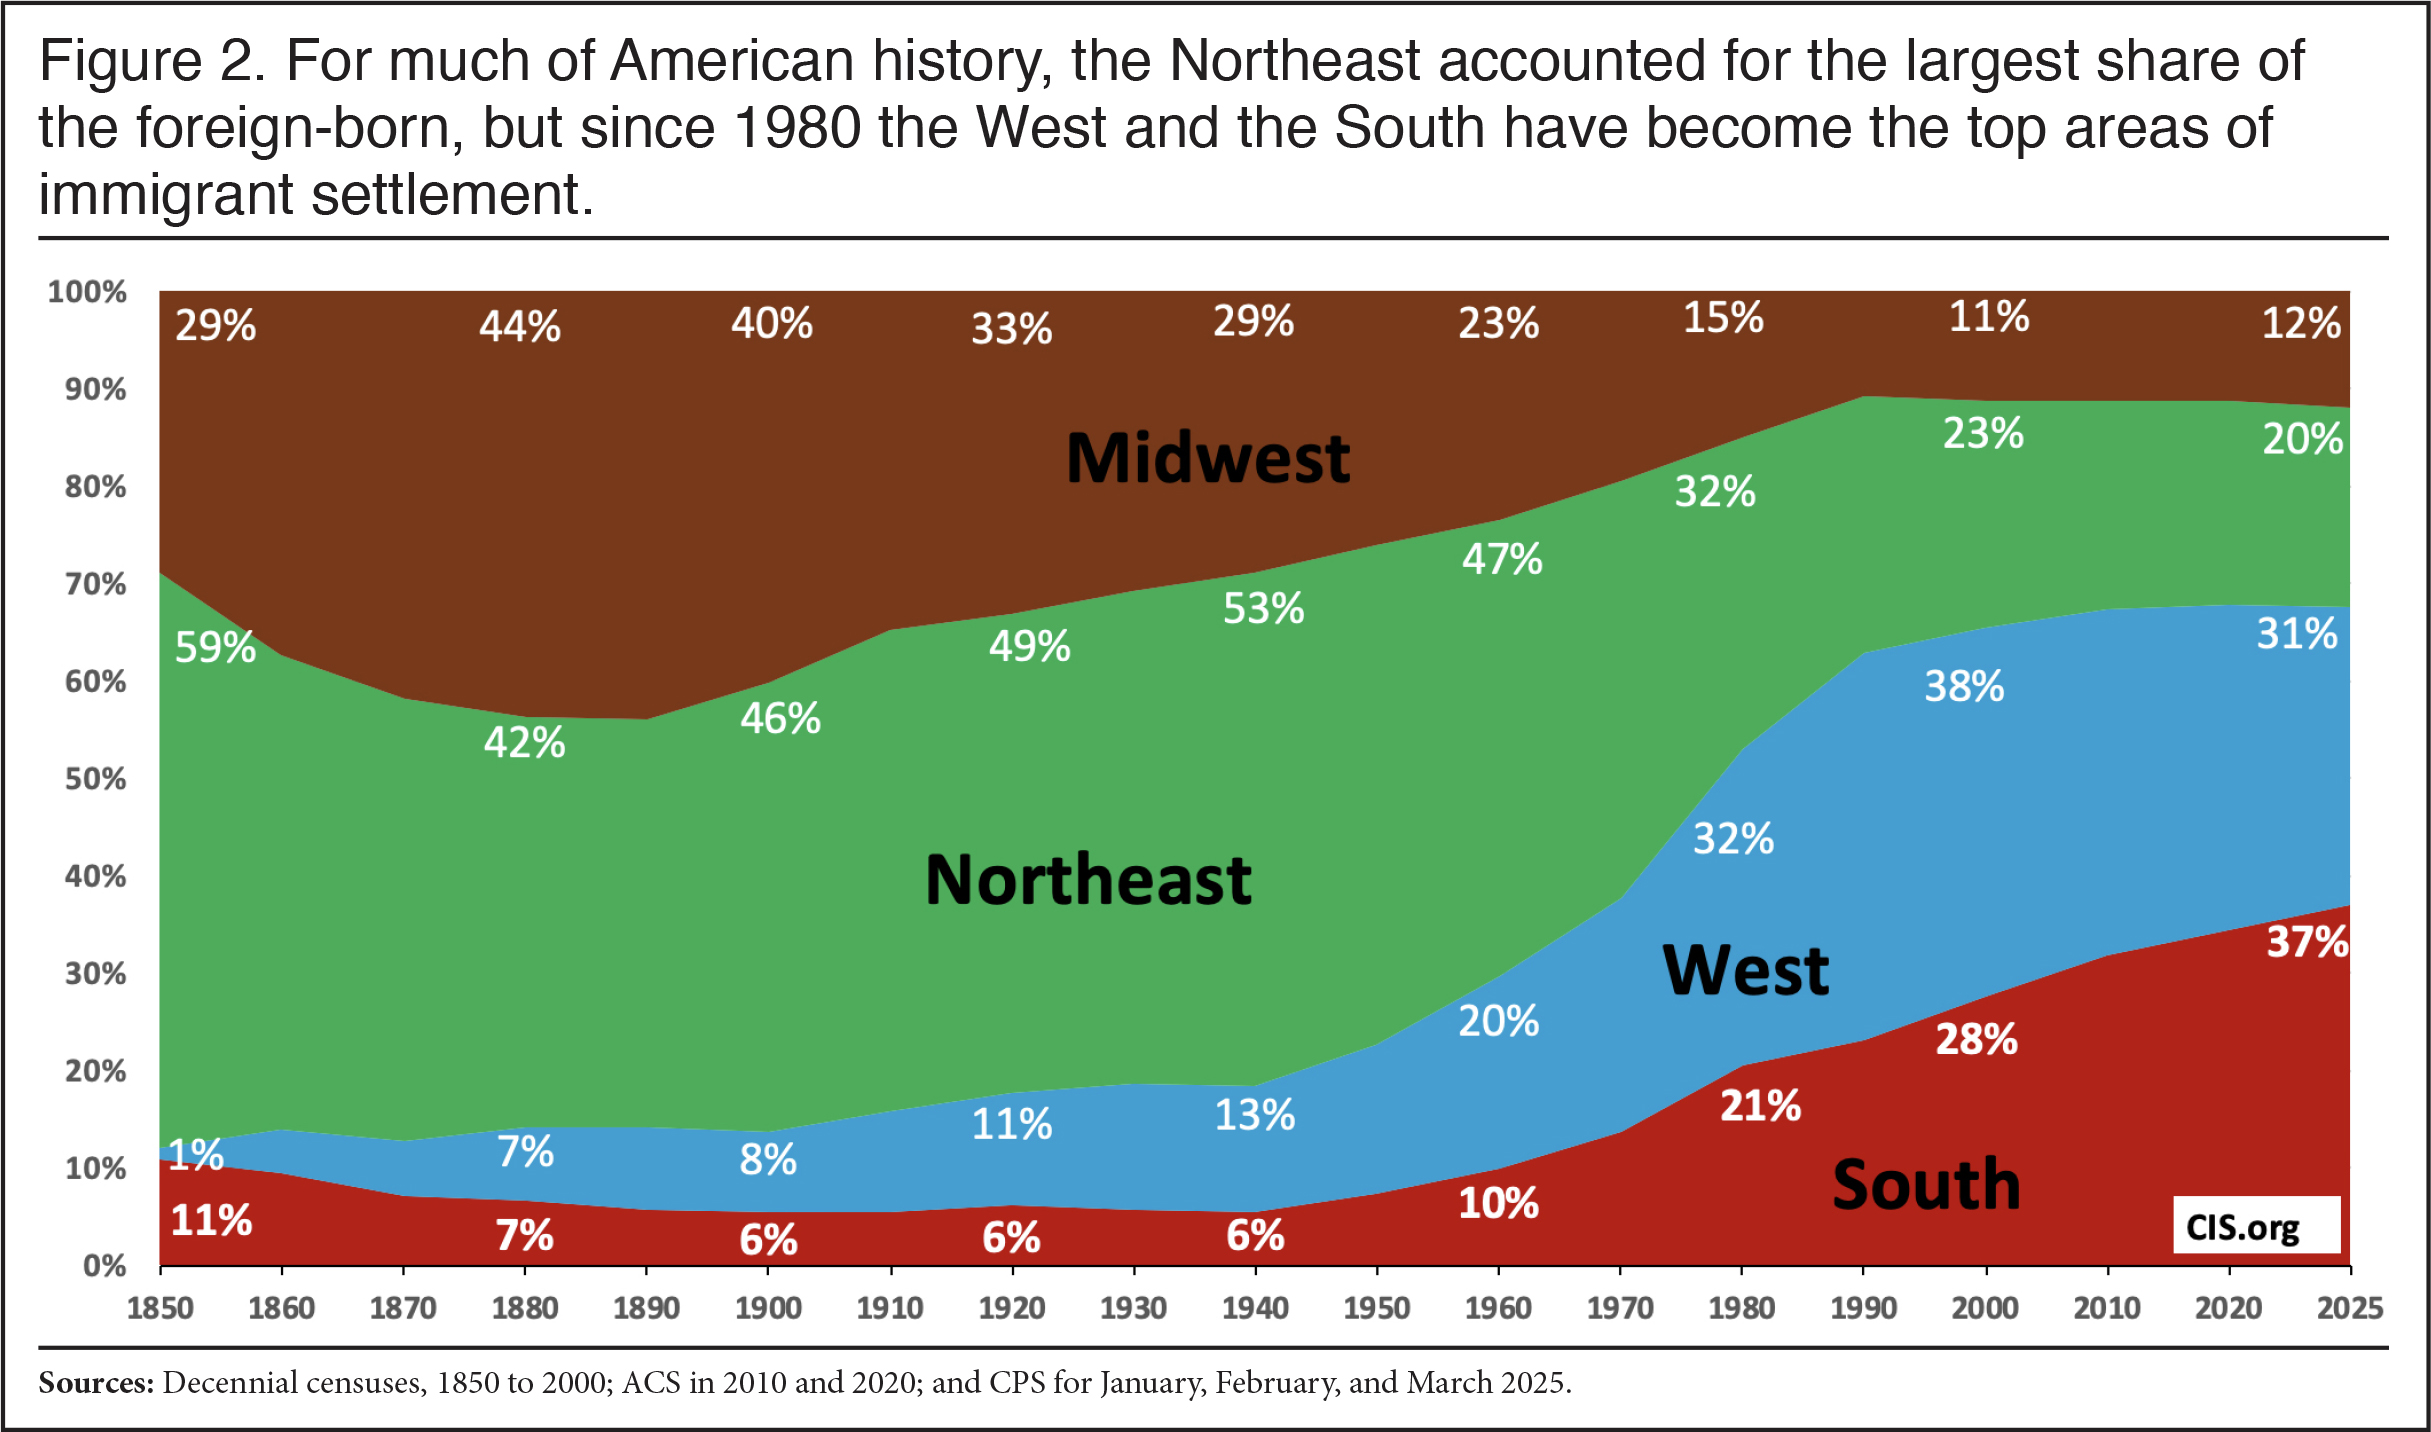
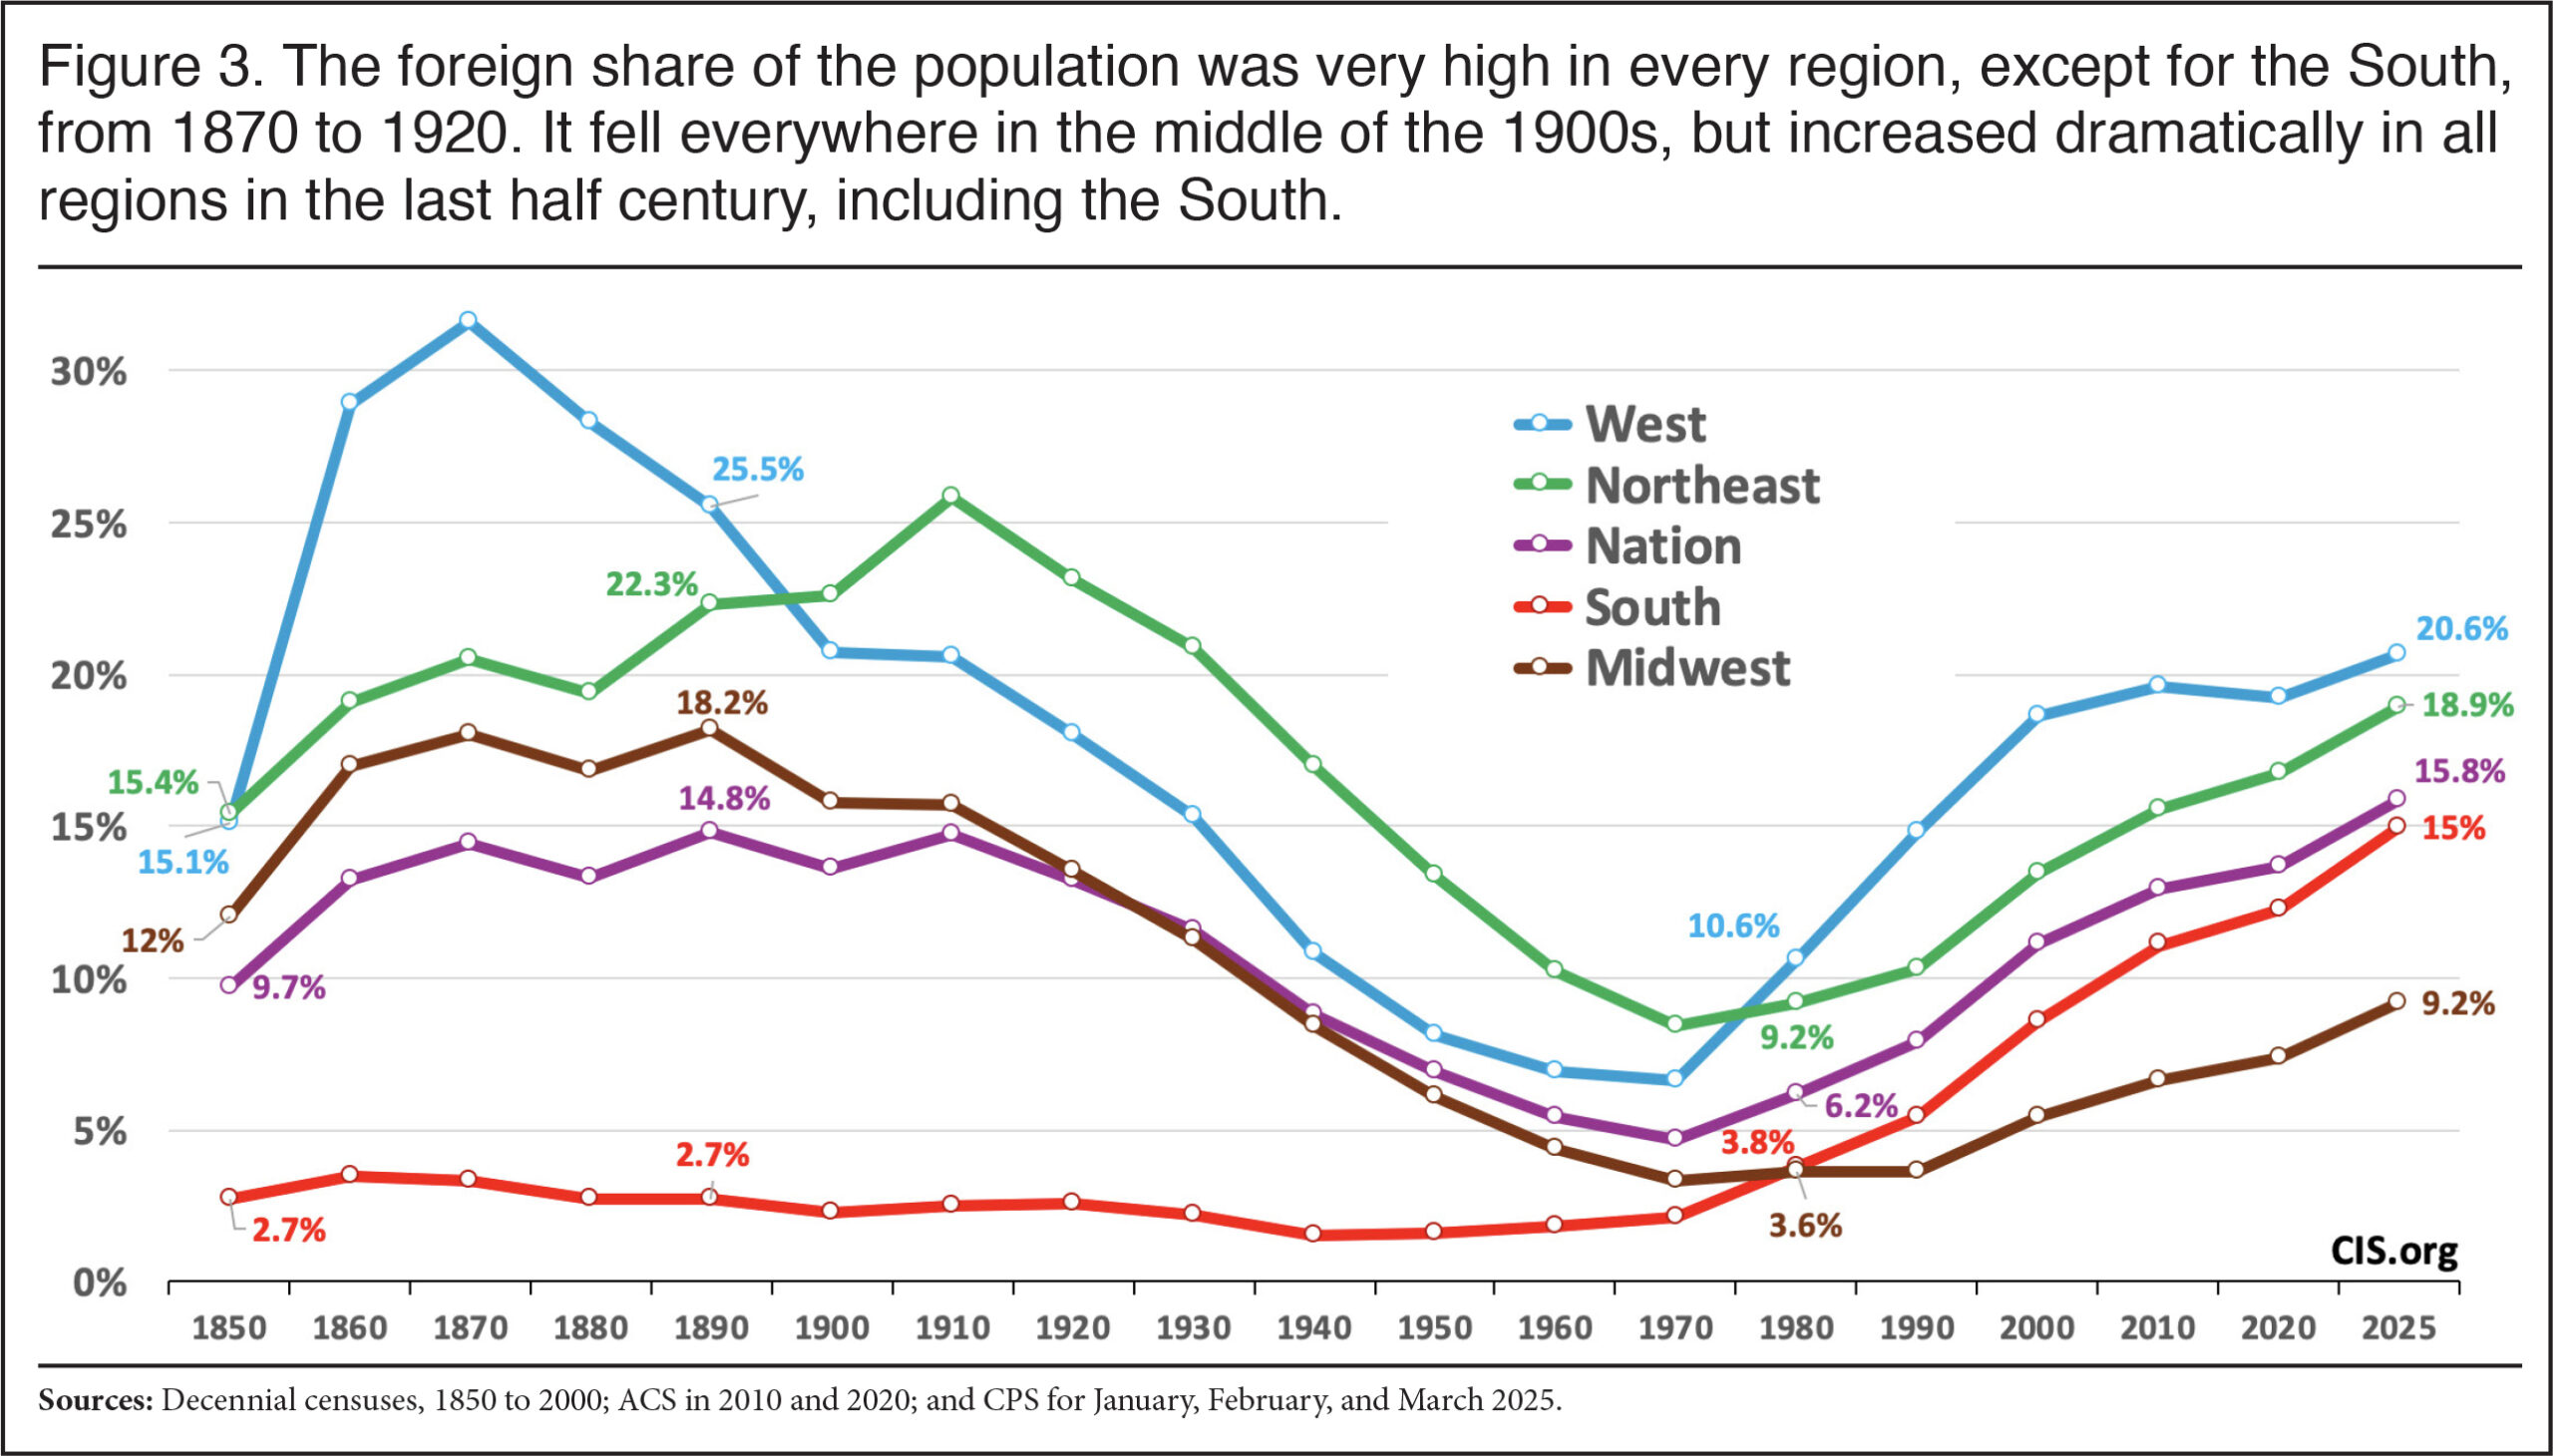
Historical Trends by Region. Figure 1 shows the number of immigrants in each region as defined by the Census Bureau.7 Traditionally the number of immigrants has been lowest in the South and highest in the Northeast.8 We can see this even more clearly by looking at Figure 2, which shows the share of the total foreign-born population accounted for by each region from 1850 to 2025. For much of the nation’s history, the Northeast received many more immigrants than other parts of the country, accounting for roughly 40 to 50 percent of the total foreign-born population until 1970. Turning to the foreign-born as a share of each region’s population, we see in Figure 3 that the Northeast and the West have had the highest percentage of the foreign-born population for all of American history. Even today, 21 percent of the West is foreign-born, as is 19 percent of the Northeast. This is substantially higher than the Midwest and the South.
 |
 |
 |
The other obvious thing about Figures 1 through 3 is that until the post-war period the number of immigrants in the South and their share of the population in that region was quite low. That has changed in the last half-century. The South now has the largest immigrant population. The increase has been extraordinary. The South accounted for 6 percent of the foreign-born population in 1940 and 21 percent in 1980 and accounts for 37 percent today. It must be remembered when looking at Figures 1 through 3 how much the populations of each region have changed relative to each other. For example, the West was a trivial fraction of the nation’s total population before 1900 and, while geographically small, the Northeast was a much larger share of the country’s population in the 1800s and early 1900s than it is today.9
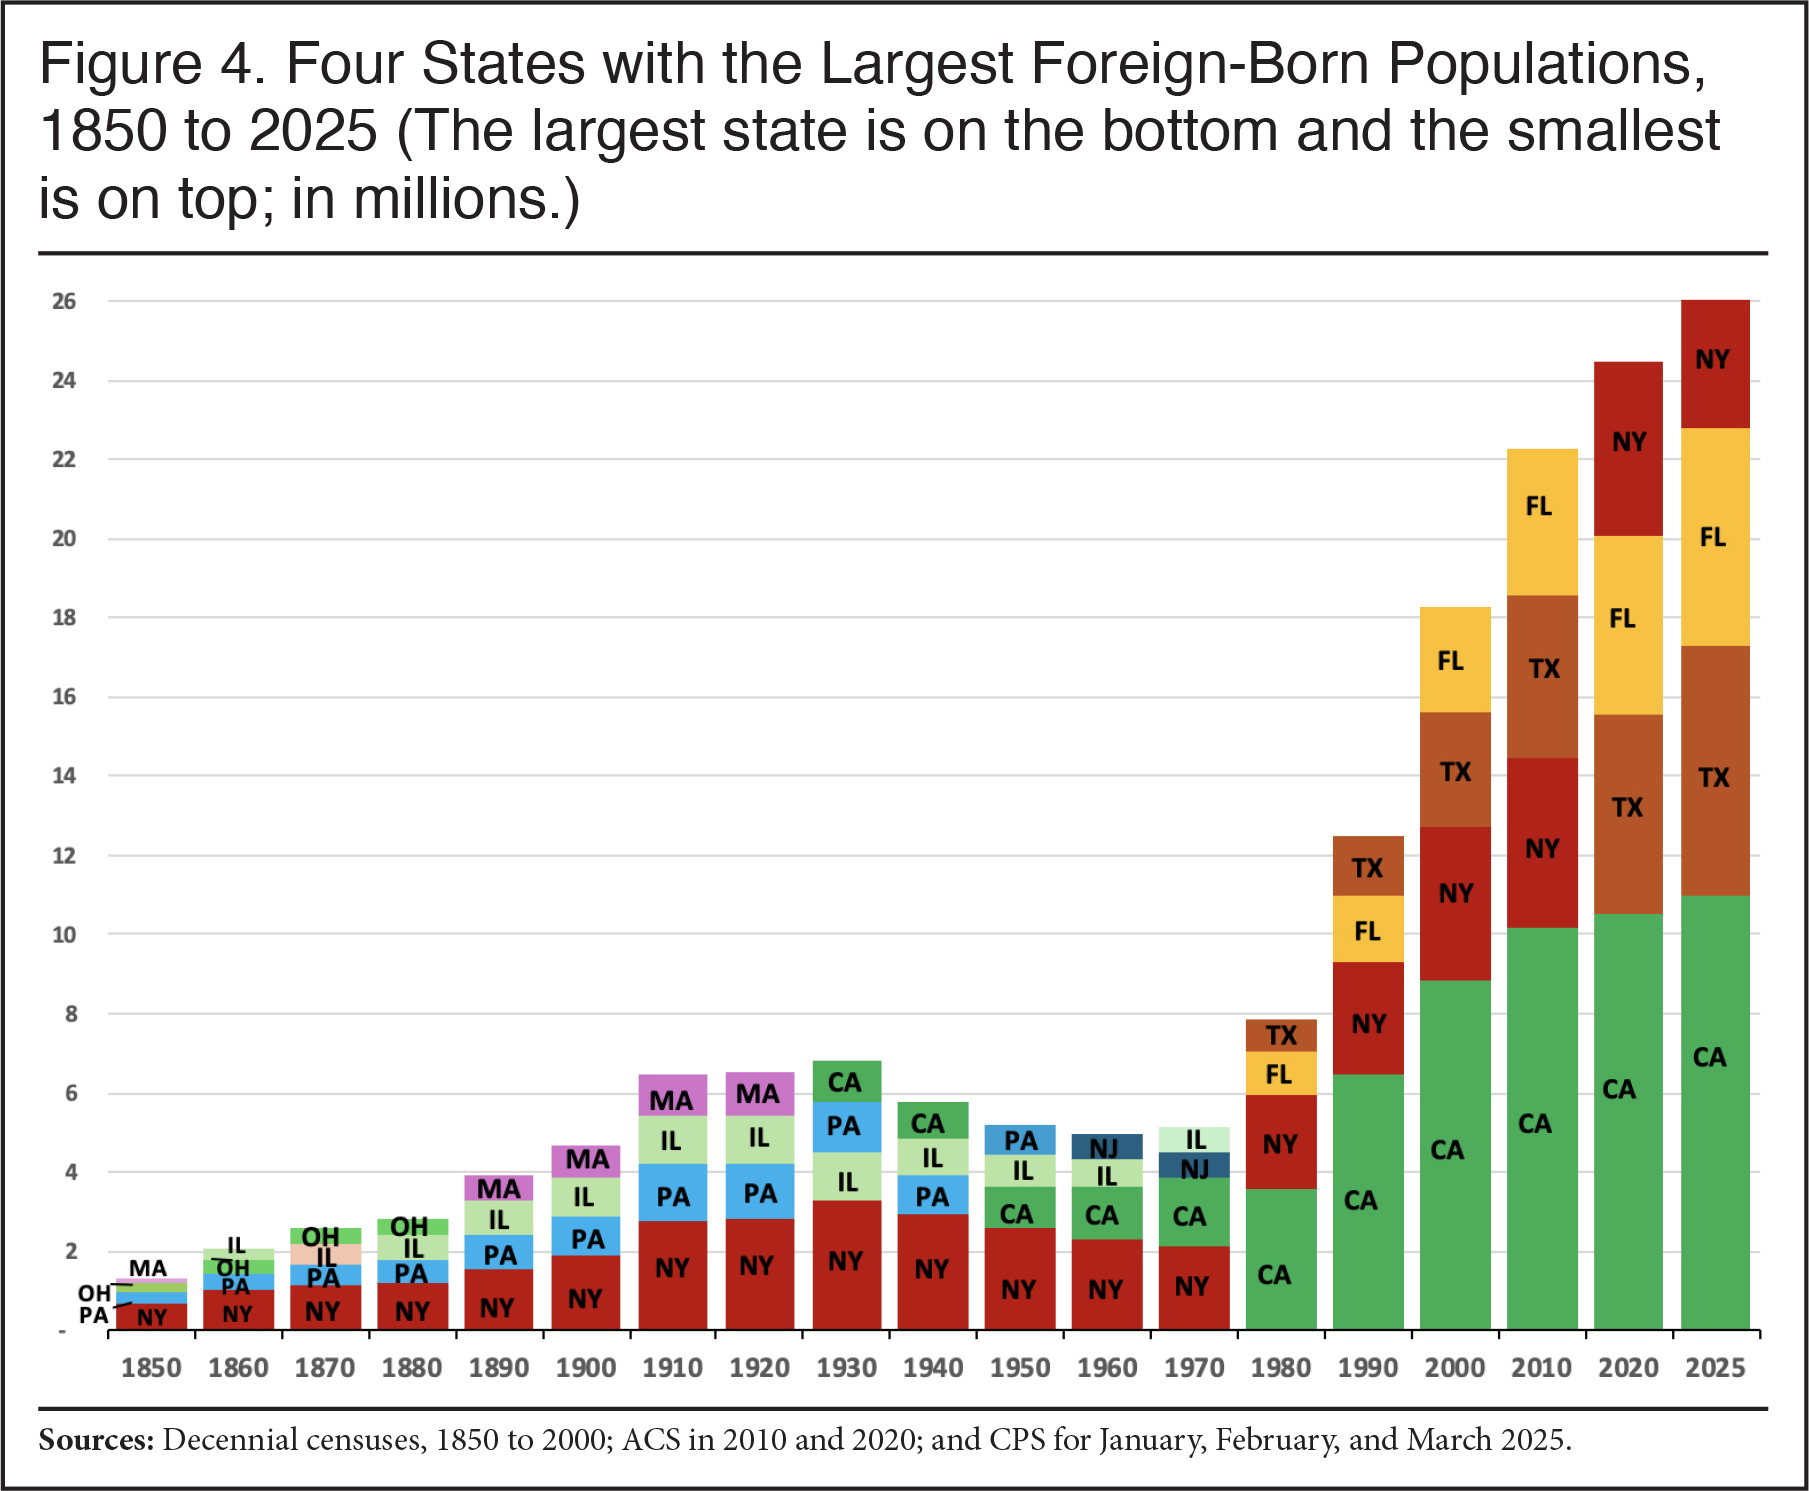
Historical Trends by State. Figure 4 reports the top four states of immigrant settlement from 1850 to 2025. Only two states, New York from 1850 to 1970 and California from 1980 to 2025, have been the top state of immigrant settlement since 1850. Figure 4 also shows that, prior to 1920, the top states of immigrant settlement were all in the Northeast and Midwest. New York was the top immigrant-receiving state for 120 years and at times was equal to the next three largest states combined. Today it ranks only fourth. Texas and Florida, which like the rest of the South were not traditionally areas of high immigration, have now become the states with the second- and third-largest foreign-born populations, respectively. Further, a midwestern state has not been among the top four states since Illinois in 1970. This is an indication that of the four regions of the country, the foreign-born population has grown more slowly in the Midwest than in the rest of the country.
 |
Regional Increases Since 1980. As already mentioned, the last 45 years have, to some extent, seen a reordering of immigration by region as immigration increased dramatically. The distribution of immigrants has shifted over time, with the Northeast ceasing to be the top area of immigrant settlement. While the number of immigrants in that part of the country increased by 6.3 million from 1980 to 2025, this figure is dwarfed by the 11.8 million increase in the West and the 16.7 million increase in the South. The growth of the foreign-born population in the South is one of the most important trends in immigration in the last 45 years. Since 1980, the foreign-born population has increased 578 percent in the South, far more than in any other region of the country. This change is all the more profound when one considers the relatively low levels of immigration to that region for most of the country’s history. Interestingly, Figure 2 shows that the West fell as a share of the total foreign-born population after 1990, even though the number of immigrants in the region continued to increase substantially. This was due to the even more dramatic increase outside of the West, primarily in the South.
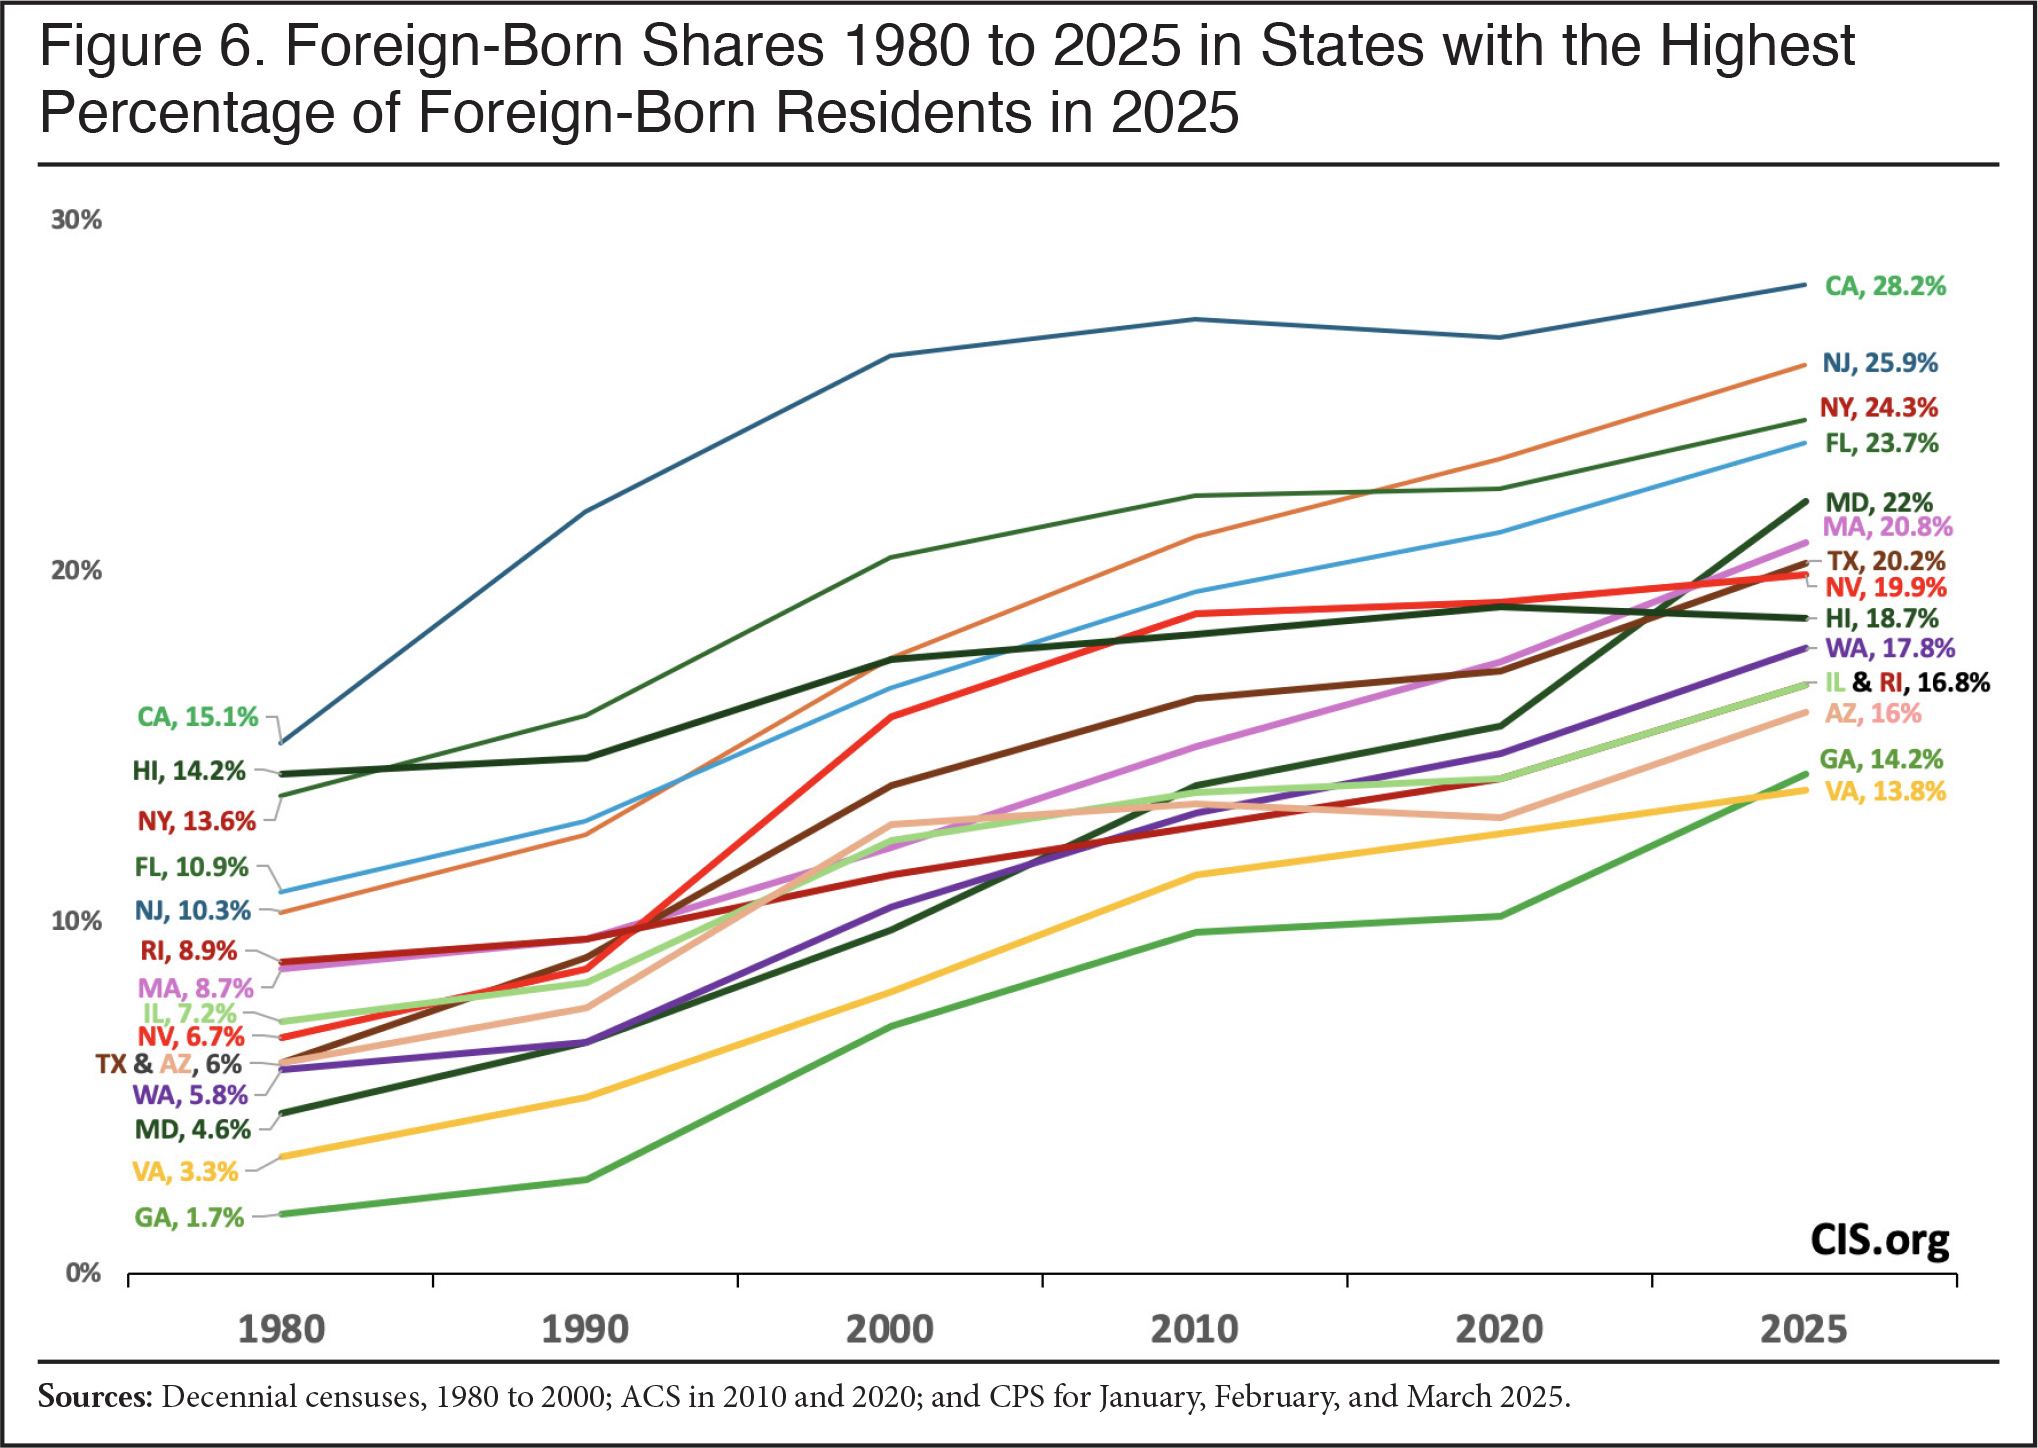
Foreign-Born Shares by State Since 1980. Figure 5 reports the foreign-born share of each state’s population in 1980 and in 2025 for the 21 states and the District of Columbia where the foreign-born represent more than 10 percent of the population in 2025. All of these states have experienced tremendous increases in the percentage of their populations that are immigrant. For example, California’s population was already more than 15 percent foreign-born in 1980, yet it nearly doubled to slightly more than 28 percent foreign-born by 2025. The increase in Georgia is particularly striking, from less than 2 percent in 1980 to more than 14 percent by 2025. Figure 6 shows the increase in each decade. In virtually every state listed, the increase in the foreign-born share from 1980 to 2010 was very large and steady, with perhaps the exception of Hawaii. The same general pattern holds from 2010 to 2025, with the exception that the increase in the foreign-born share in California, New York, and Nevada slowed somewhat after 2010. Figure 6 shows the states where immigrants make up the largest share of the population; the overall pattern in the last 45 years has been for the foreign-born percentage of the population to increase in nearly every state. We can see this clearly by looking at Map 1, which shows the foreign-born share of the population in every state in 1980, and Map 2 which shows the same information for 2025.
 |
 |
Map 1: 2025 Immigrant Share
<4>
5% to 9.9%
10% to 14.9%
15% to 19.9%
>20%
Map 2: 1980 Immigrant Share
<4>
5% to 9.9%
10% to 14.9%
15% to 19.9%
>20%
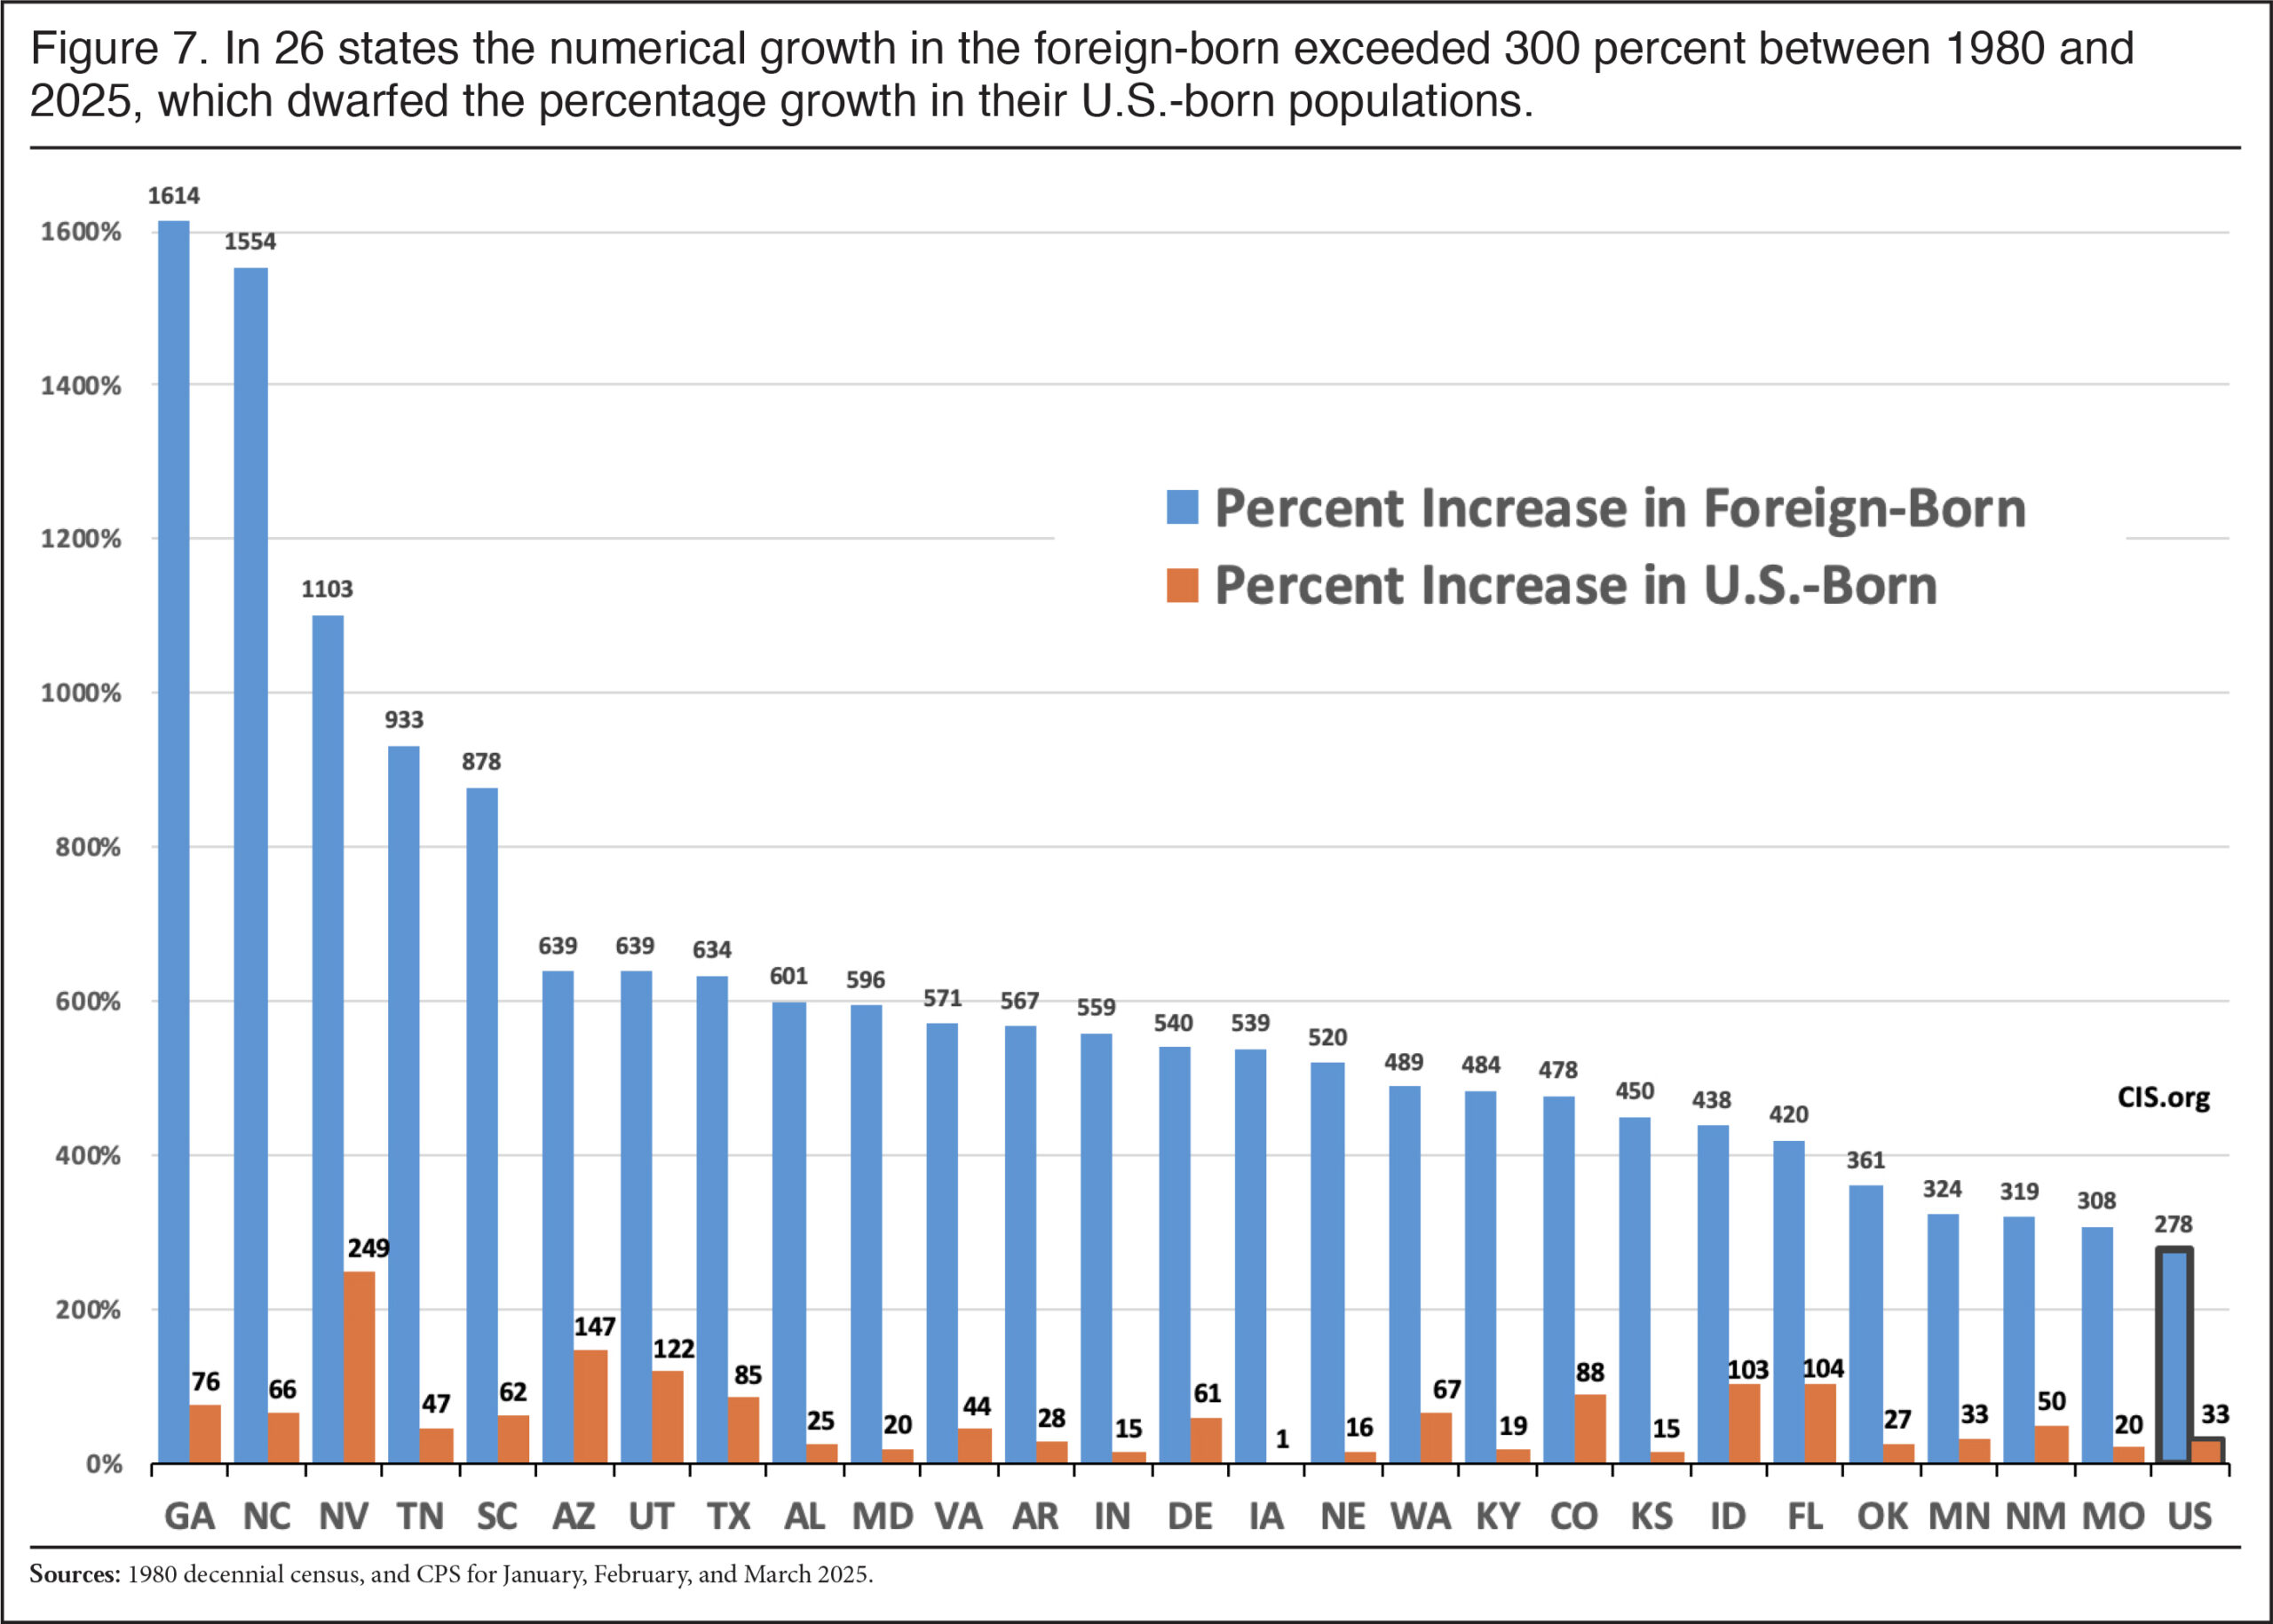
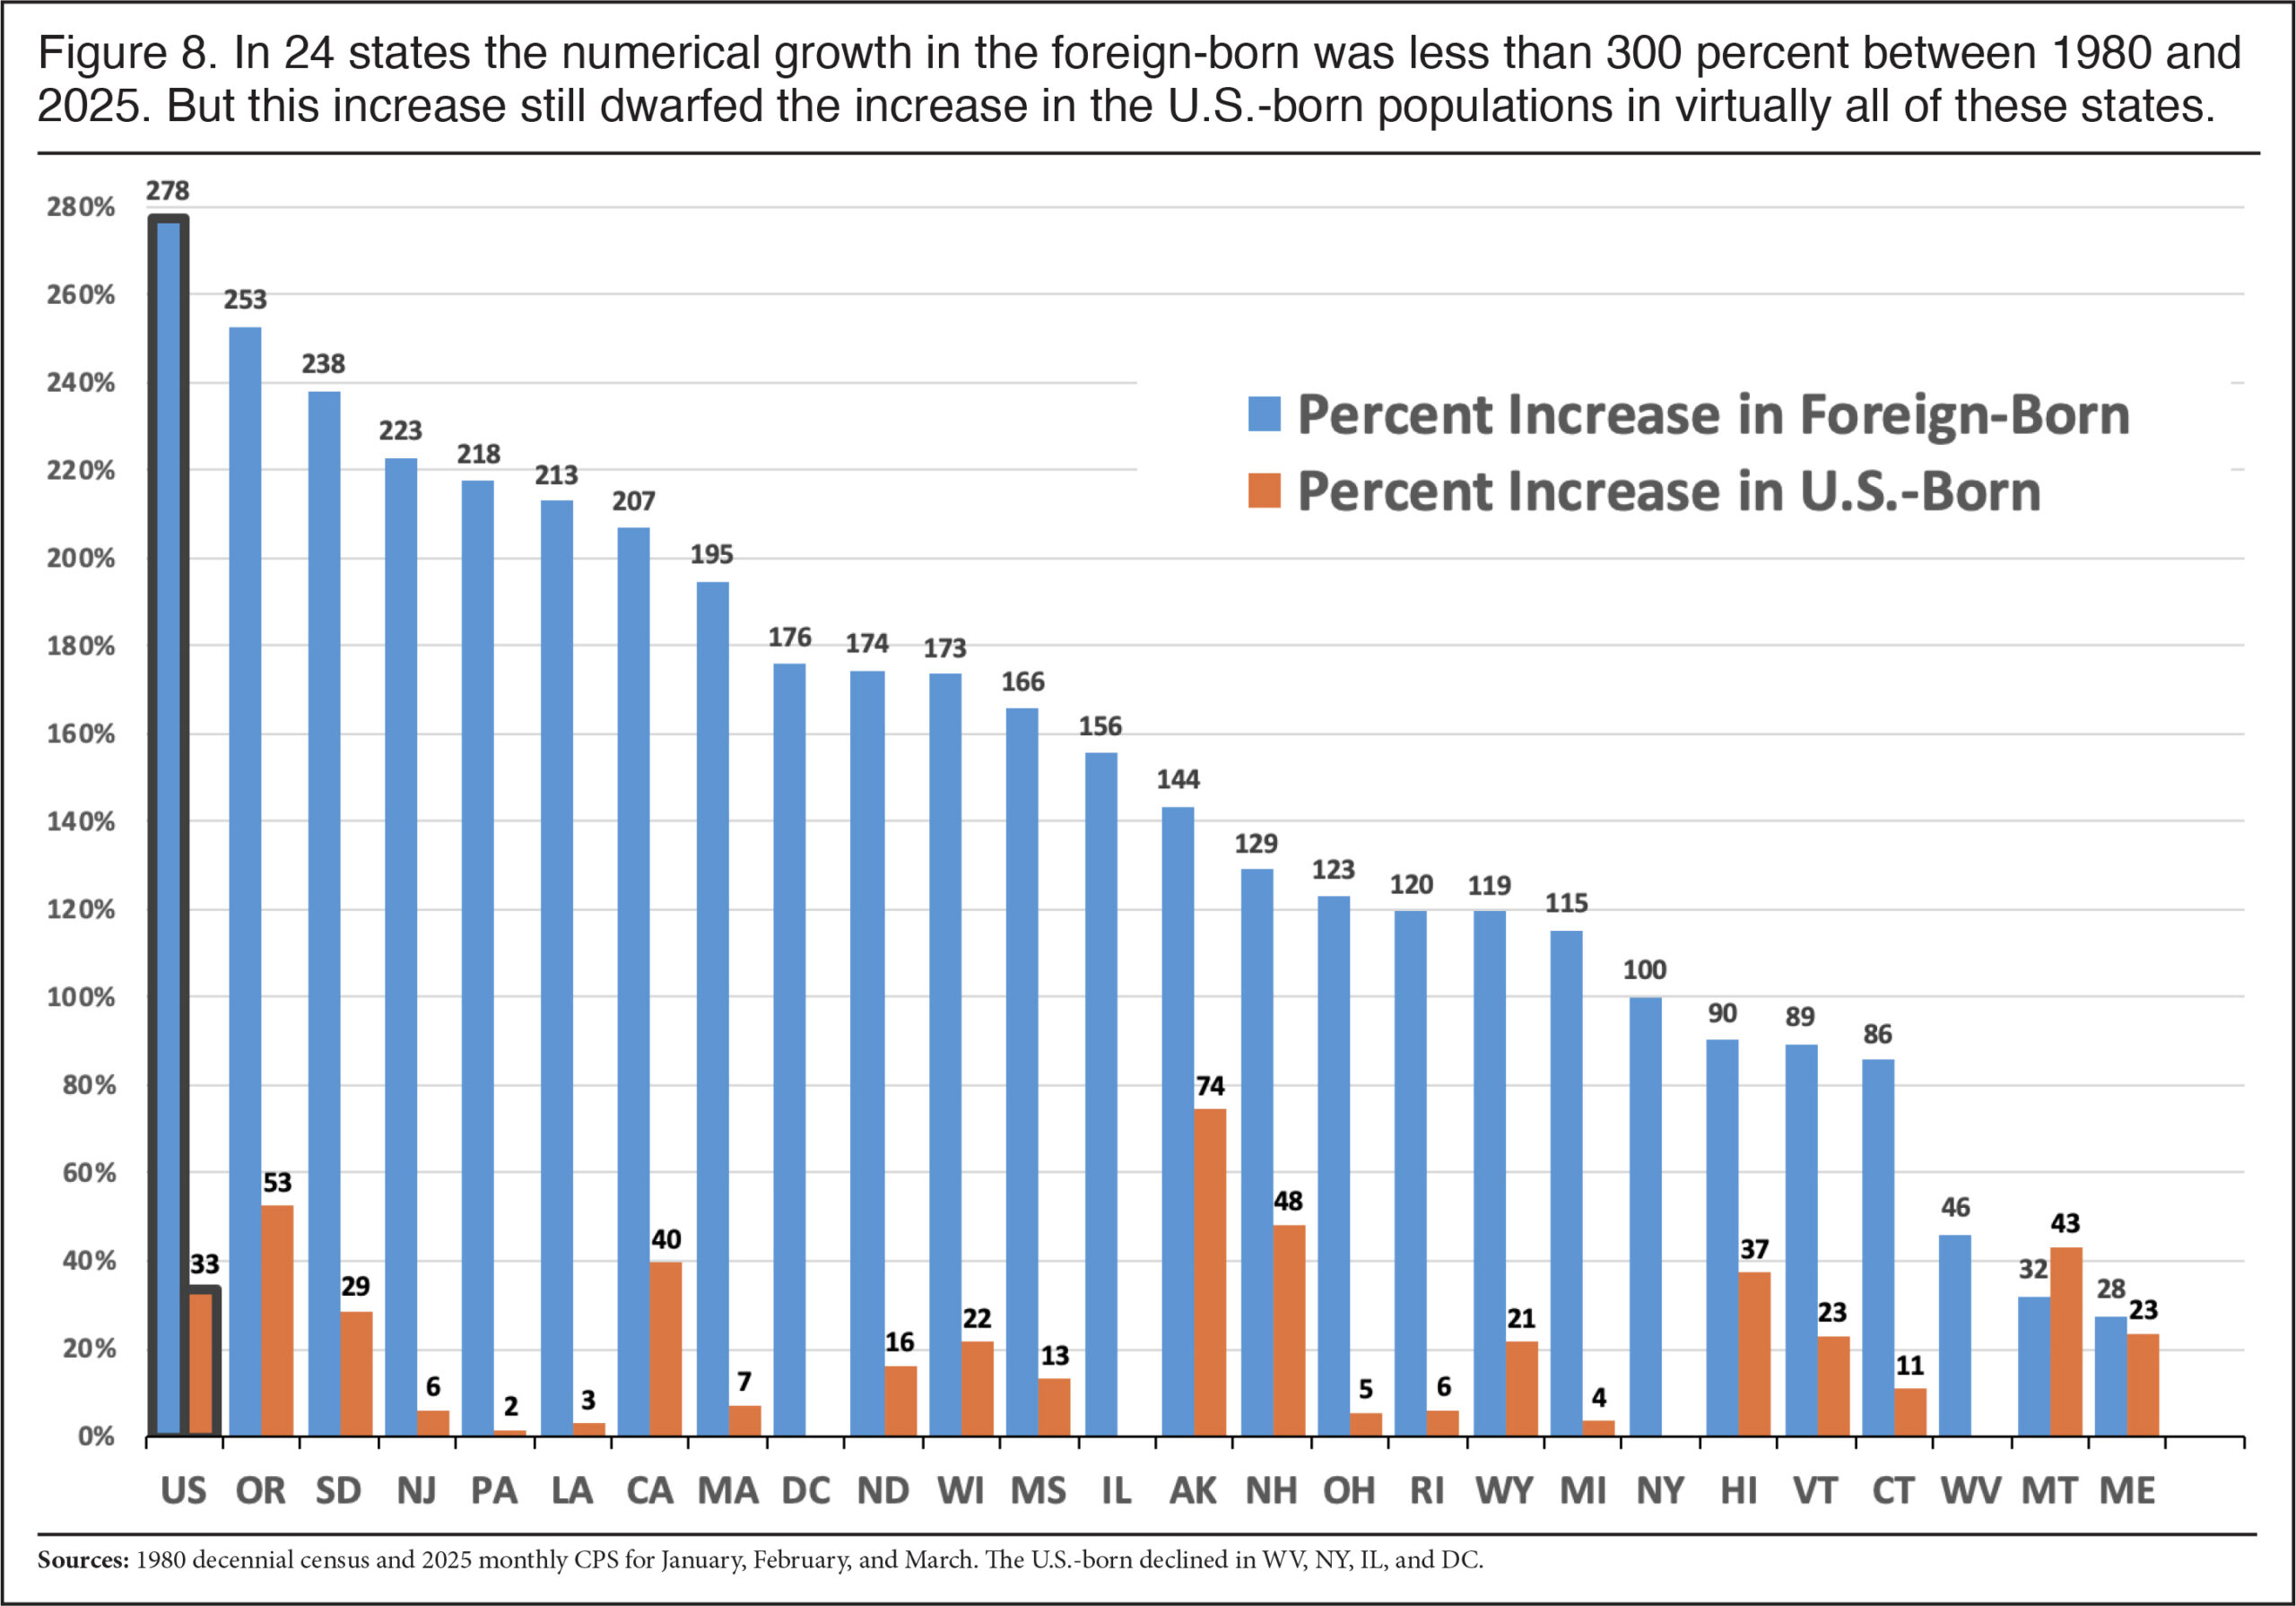
Numerical Increase by State Since 1980. Figure 7 shows the 26 states where the foreign-born population grew by more than 300 percent between 1980 and 2025. It also shows the growth for the U.S.-born population, which includes the U.S.-born children born after 1980 to immigrant parents. Figure 8 shows the increase in the other 24 states and the District of Columbia. Map 3 shows the percentage increase in the size of the foreign-born population in each state since 1980. The increase in the size of the foreign-born population in the last 45 years has been truly phenomenal in many states, such as the more than 1,000 percent increases in Georgia, North Carolina, and Nevada or the more than 800 percent increases in Tennessee and South Carolina. Although the increase in the size of the foreign-born population nationally since 1980 was huge at 278 percent, the increase in several states has been many times that amount. Also, compared to the growth in the U.S.-born population, the increases are particularly striking in many states. For example, nationally the foreign-born population grew eight times faster than the U.S.-born population, but in 17 states the foreign-born population grew 20 times faster than the U.S.-born population; and in seven others it grew more than 10 times faster than the U.S.-born population.
 |
 |
Map 3: Percent Change between 1980 and 2025
<100%>
5% to 9.9%
100 to 199%
500 to 899%
>900%
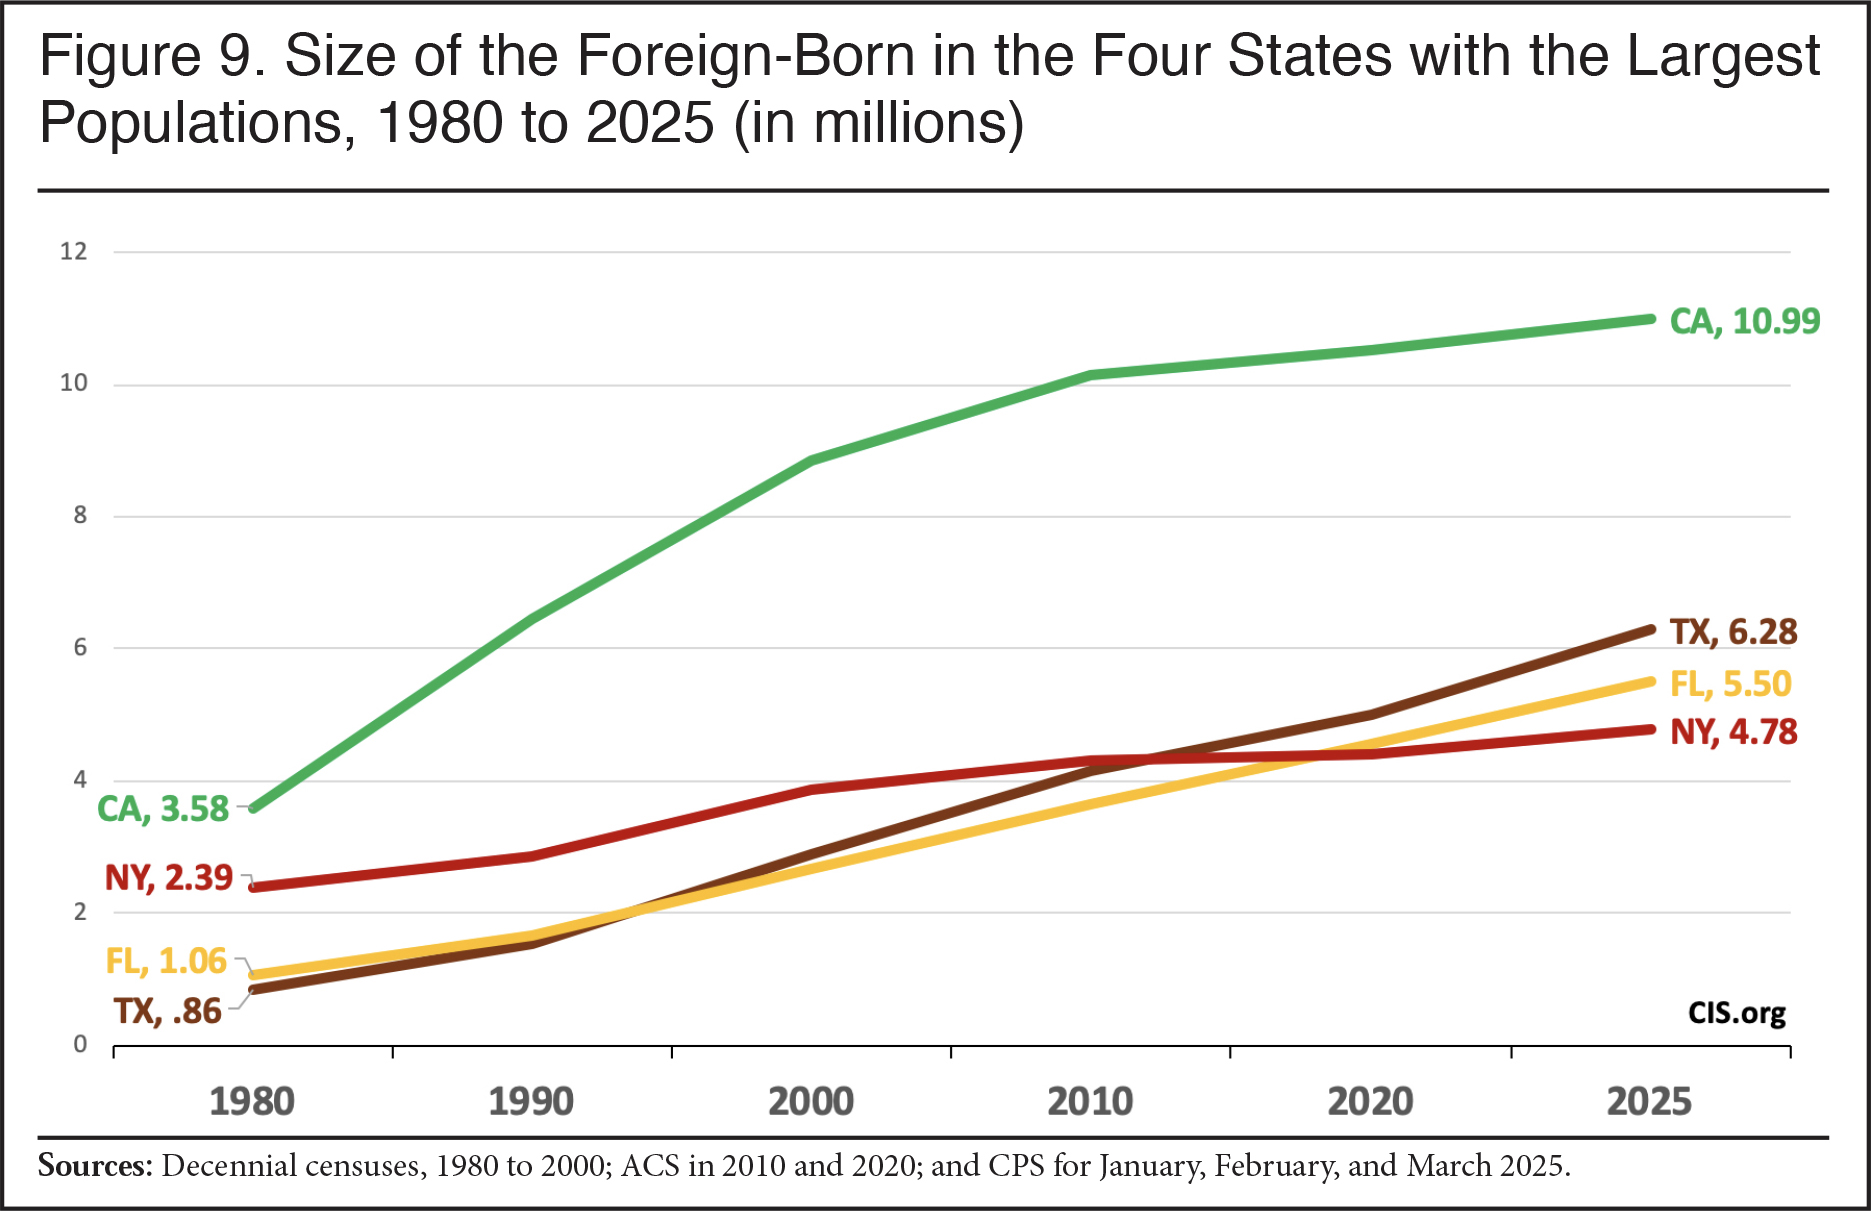
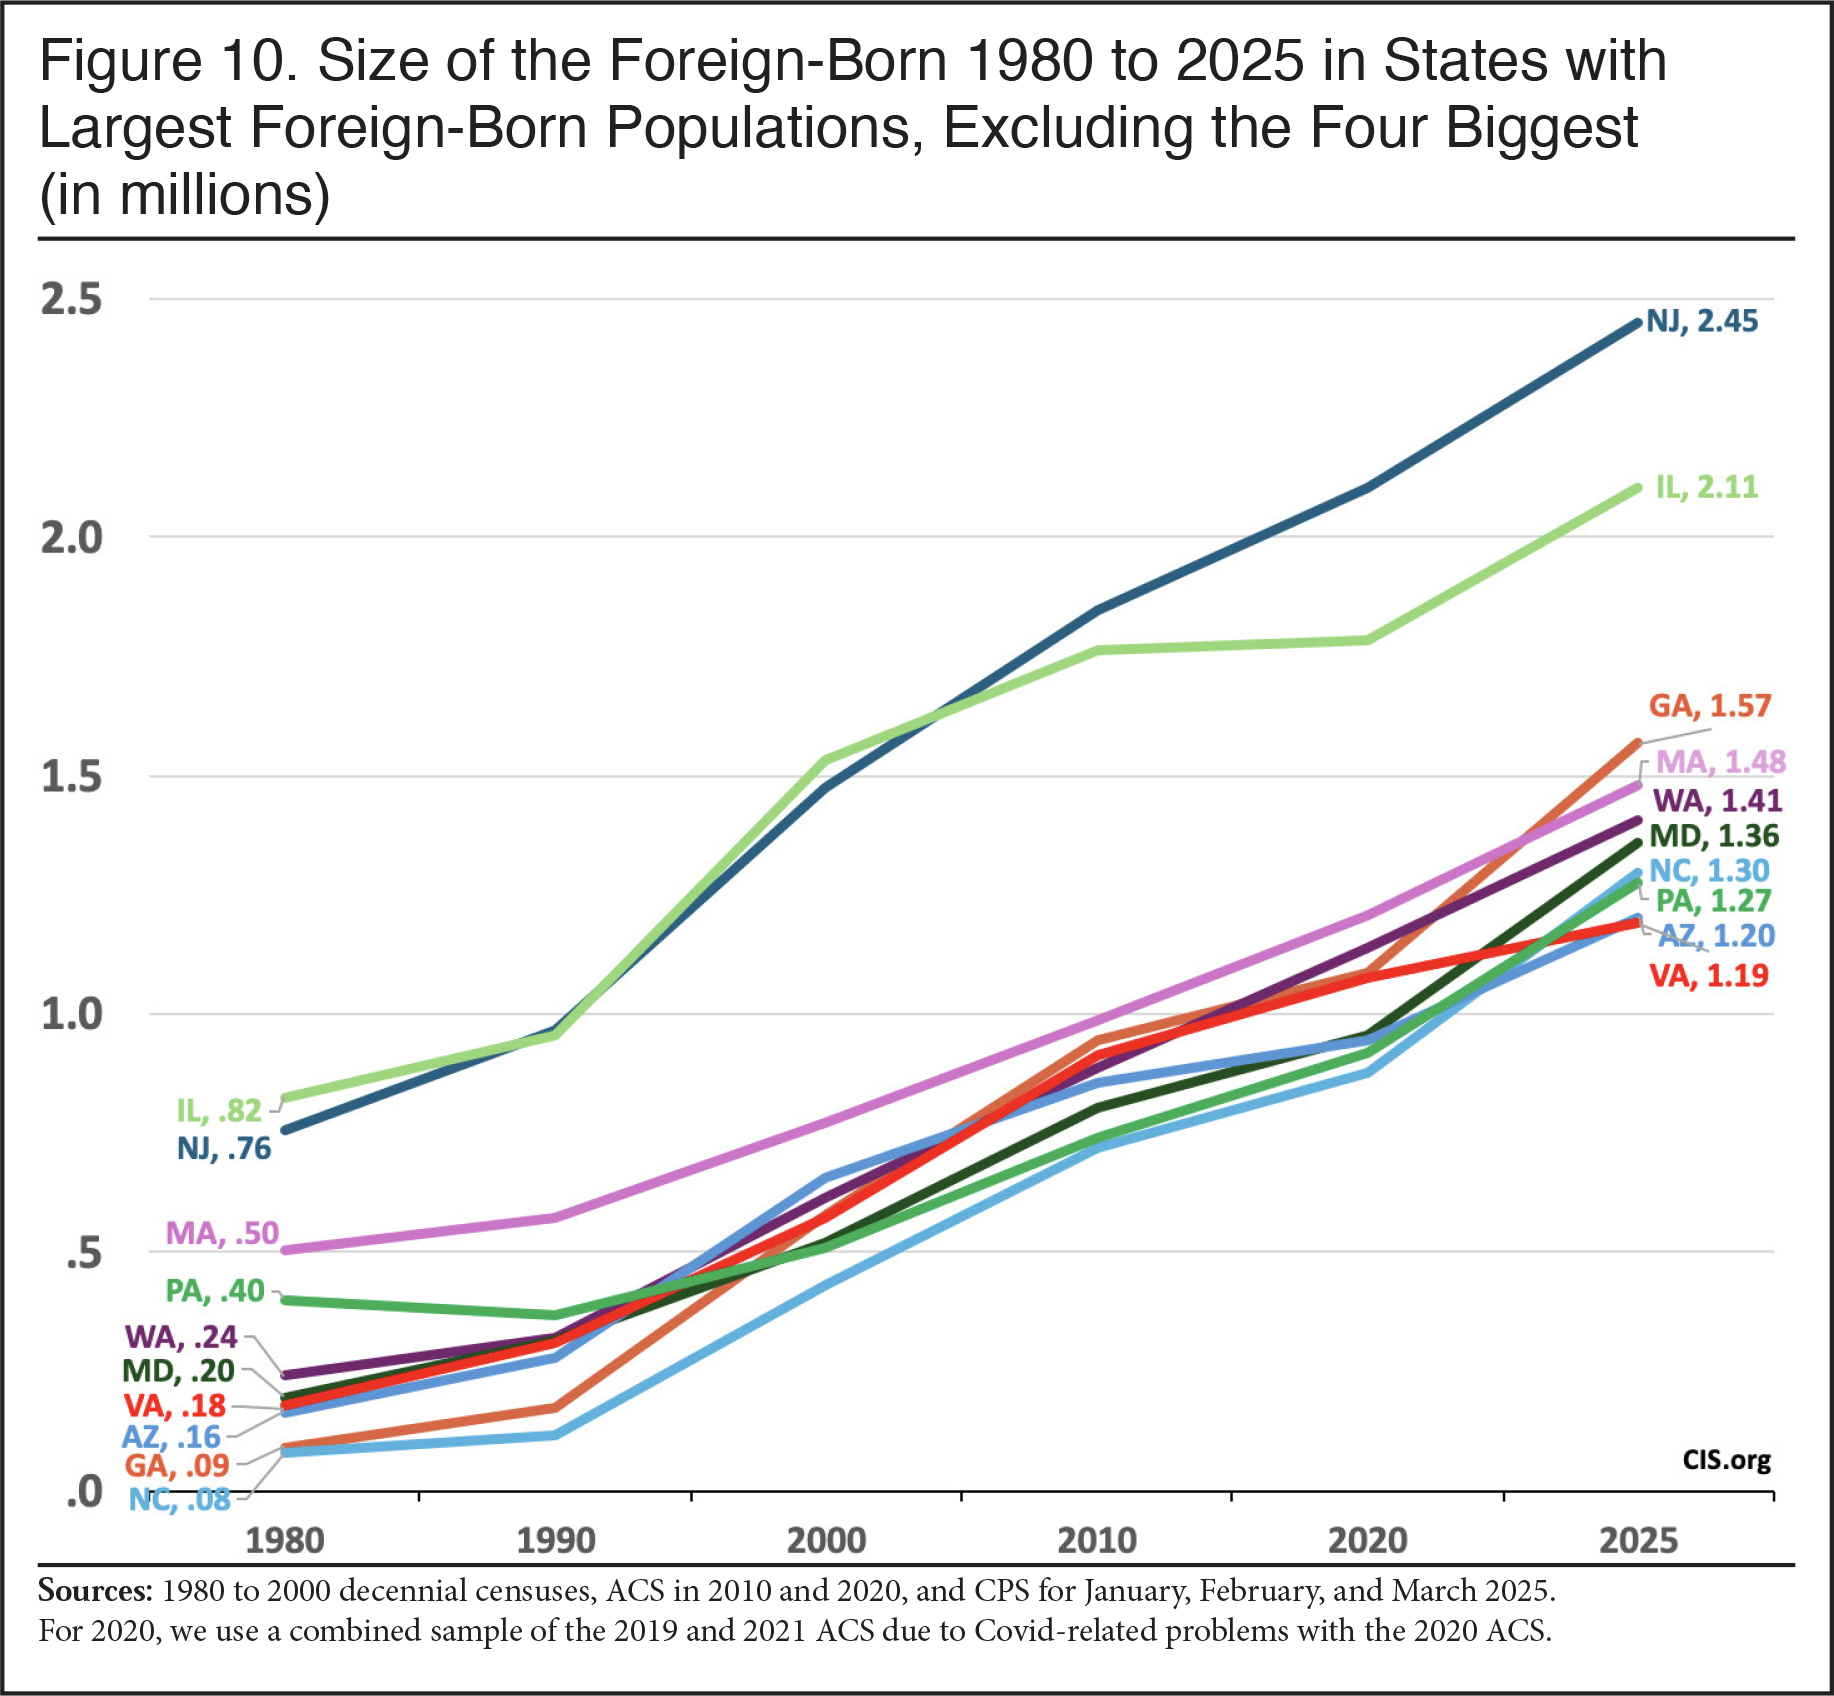
Texas and Florida Since 1980. The size of the increase in the foreign-born population stands out in two states in particular since 1980: Florida and Texas. The immigrant population grew by 5.4 million in Texas and by 4.4 million in Florida. These two states accounted for one-fourth of the total increase in the foreign-born population in the country, even though they accounted for only about 16 percent of the country’s total population in 2025. Figure 9 shows the number of immigrants in the top four states of immigrant settlement for each decade from 1980 to 2020 and in 2025. Two things stand out in Figure 9: the enormous number of immigrants in California relative to every other state and, again, the spectacular increases in Texas and Florida, which have significantly outpaced growth in New York. Figure 10 reports the number of immigrants over the same period for states that had at least one million immigrants by 2025. In 1980, just three states had more than one million foreign-born residents, and Texas was not even one of them. But by 2025 there were 14 such states. For more information on the size of the foreign-born population in each state going back to 1850, see Excel Table 1.
 |
 |
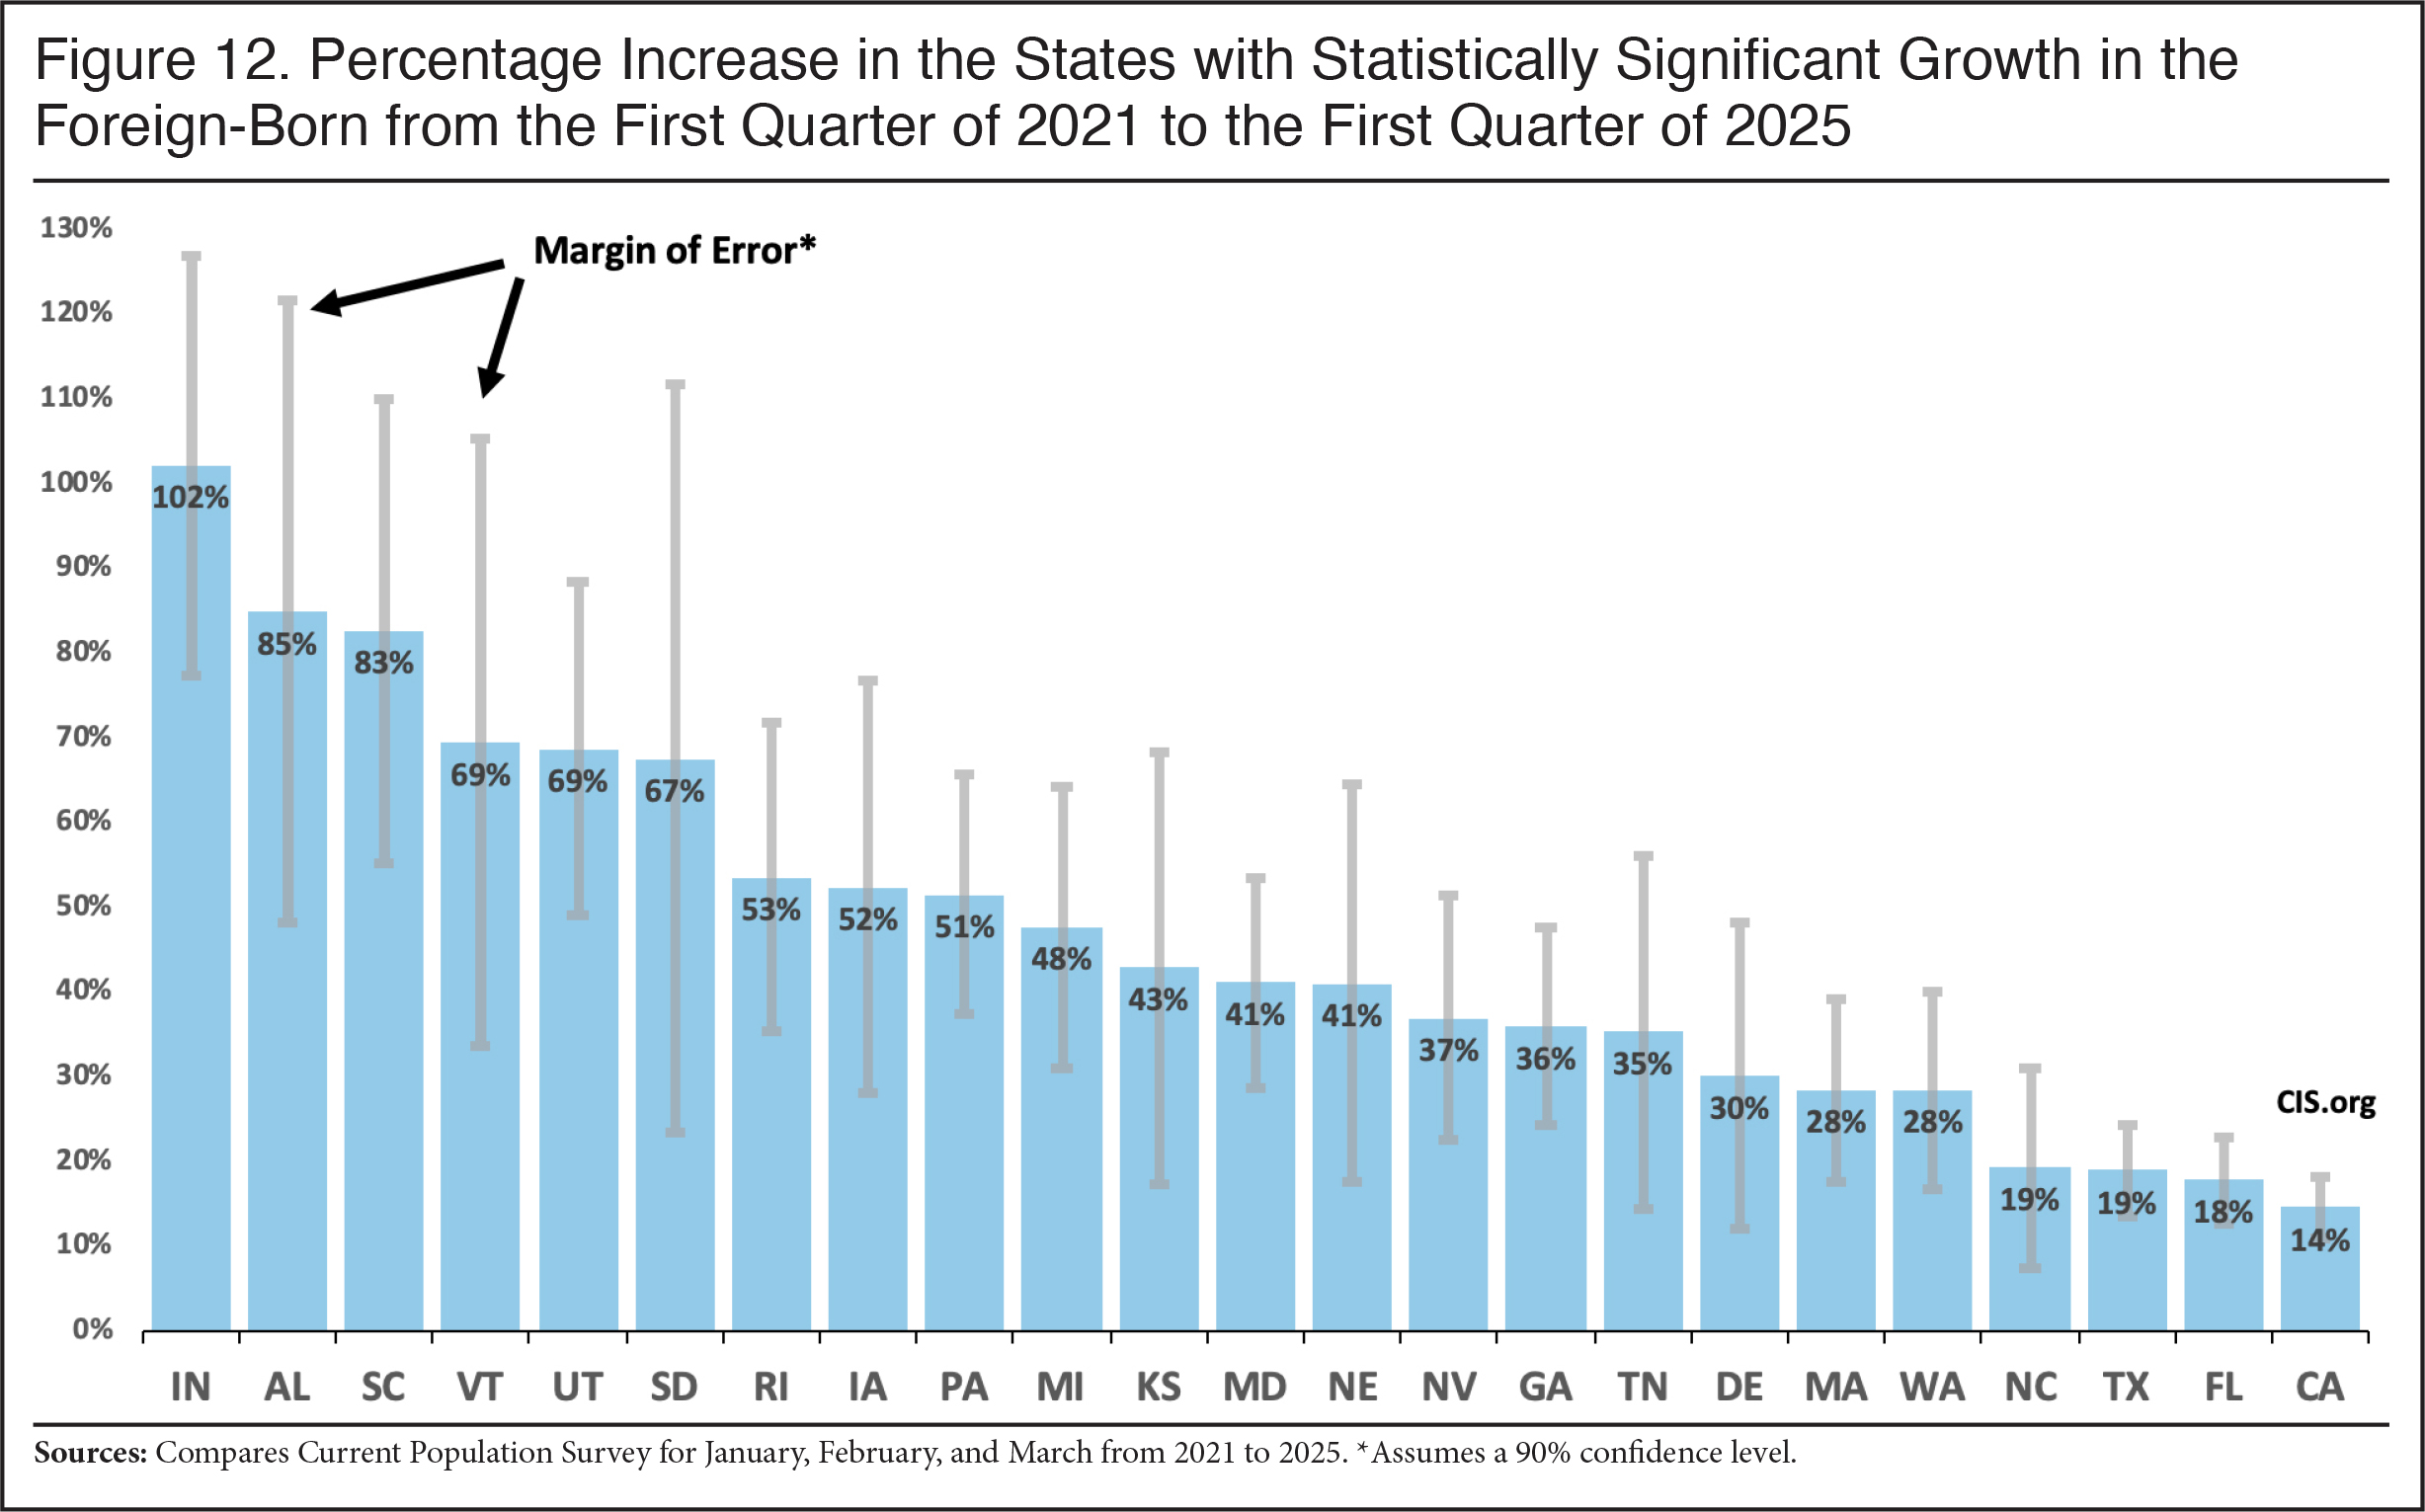
Surge Since 2021. As already mentioned, the Center has documented the dramatic increase in the number of immigrants in the country since 2021 using the Current Population Survey. Figure 11 shows the numerical increase in the size of the foreign-born population between the first quarter of 2021 and the first quarter of 2025 in the 24 states where there was a statistically significant increase. It may not be too surprising that California, Florida, and Texas all have had large statistically significant increases since 2021. But many other states have experienced a significant surge over this time period as well, including Pennsylvania, Georgia, Maryland, Indiana, Massachusetts, Washington, and Michigan. Figure 12 shows the percentage increase in states with statistically significant increases. The percentage increases are enormous in many of these states, though the large size of the margin of error in some of these states means the increases should be interpreted with caution. Still, in Indiana, South Carolina, Utah, Rhode Island, Pennsylvania, Michigan, and Maryland the percentage increases are very large, even considering the size of the confidence interval. The recent surge in immigration has added significantly to the foreign-born population both in states where immigrants have traditionally settled, but also in others where the foreign-born population was not so large.
 |
 |
 |
Conclusion
It is a simple truism that the demographic, cultural, fiscal, economic, and political impact of immigration stems directly from the size of the foreign-born population. The foreign-born or immigrant population, legal and illegal together, hit a record high at the start of 2025 in the country as a whole, so it is not surprising that this analysis shows that it has grown in every region of the country and in almost every state. We find that the distribution of immigrants has shifted over time. During the so-called Great Wave of immigration from 1870 to 1920, the Northeast accounted for roughly half or nearly half of the foreign-born population, with New York the top state of immigrant settlement for 120 years, until 1970. The Midwest was also a top area of immigration in the early part of the Great Wave.
When immigration was reduced substantially by World War I and then by restrictive legislation in the early 1920s, the size of the foreign-born population and its share of the total population fell from the 1920s to the 1970s, though the Northeast and New York still accounted for a very large share of the total immigrant population. However, since the 1960s the Northeast has declined as a share of the total immigrant population, even as the number of immigrants and their share of the population in that region increased substantially. The massive increase in the foreign-born population in the West, primarily in California, and the South outpaced what was also a substantial increase in the Northeast and even the Midwest. The immigrant population has grown enormously in southern states like Texas, Florida, North Carolina, Georgia, Maryland, and Virginia both numerically and as a share of their populations since 1980. Today, the South has significantly more immigrants than any other part of the country, though immigrants still represent the largest share of the population in the West and Northeast. While the number of immigrants in the Midwest has grown, relative to the rest of the country that region has by far the smallest foreign-born population both numerically and as a share of that region’s population.
We also have shown in the analysis that the huge surge in new immigration between 2021 and 2025 and the resulting increase in the size of the foreign-born population has added significantly to the foreign-born population in some states that already had large immigrant populations in 2021, such as California, Florida, and Texas. But the recent surge in immigration has also impacted other states that had smaller foreign-born populations, such as Indiana, South Carolina, Utah, Rhode Island, Pennsylvania, and Michigan.
Immigration has increased dramatically in recent decades. However, the impact is still more concentrated in some parts of the country than others. In 1980, the foreign-born were 10 percent or more of the population in only five states; by 2025 this was the case in 21 states plus the District of Columbia. There were also only three states in 1980 with more than one million immigrants; by 2025 there were 14 such states. Our analysis of the size of the growth of the foreign-born population across the country shows that it has become a truly national issue in a way that was not the case four and a half decades ago. This is likely to be true for the foreseeable future.
Appendix: Measuring the Foreign-Born Population Over Time
Nativity Prior to 1850. For most of American history the decennial census has asked about citizenship or place of birth. This allows us to compare the size of the foreign-born population over time, though it is important to understand the differences between each decennial census as well as surveys collected by the bureau in more recent decades. In 1820, for the first-time the census recorded the number of white residents who were “foreigners not naturalized” in each household. In the 1830 census, the same basic citizenship question was included. The number of naturalized citizens is not identified. No place of birth is recorded either. This information was not recorded for slaves. It may be possible to estimate the size of the total foreign-born population in 1820 and 1830 by extrapolating from the limited information available, but it is not directly measured in either census.
Nativity Before the Civil War. Starting in 1850, a question allowing for the identification of the entire foreign-born population was included in the census, as no question related to nativity was asked in 1840. In the 1850 census, non-slaves’ place of birth, including foreign countries was collected. The foreign-born, as already noted above, are all those who were not U.S. citizens at birth. All subsequent censuses asked this question, until 2010, though in some censuses from 1960 to 2000 only a sample of households were asked place of birth. A question on place of birth very similar to the question on the 1850 census was included in the 1860 census, and again place of birth was not collected for slaves. Although it is very reasonable to assume that everyone born outside the United States was foreign-born in the 1800s, doing so does count as foreign-born those born aboard of American parents, who were American citizens at birth. Asking place of birth means that these individuals, though very small in number in the 1800s and early 1900s, are counted as foreign-born. In more recent censuses and government surveys these individuals are identified and not included in the foreign-born population. This creates a small break in the historical continuity of counts of the foreign-born. However, as best we can tell, the impact should be trivial.
1870 to 1890 Censuses. The 1870 census represents a departure in that men 21 and older were asked if they were citizens of the United States. This was the first time since 1830 that citizenship was asked, though as was true in the past, citizenship was not asked for the entire population. This was also the first census to ask if a respondent’s mother and father were foreign-born, but parental place of birth is not recorded. As in 1850 and 1860, information on each individual’s place of birth is recorded, this time including former slaves. This allows for the identification of the foreign-born. The 1880 census asked all persons about their place of birth, though no citizenship question was included. This is also the first census to record parents’ place of birth. Every census from 1880 to 1970 records parental birthplace. The 1890 census responses were lost in a fire in 1921, so public-use data is not available for analysis from this census. However, the results of the census, including the foreign-born population, were published based on the birthplace question. Whether respondents were naturalized was also recorded in 1890 as was parental place of birth and year of immigration. Combining responses to the naturalization question with responses to the place of birth question it should have been possible to determine the number of naturalized citizens and non-citizens for the first time for the entire population, assuming all persons were actually asked if they were naturalized. However, to date we have not found any published document reporting this information and, as discussed below, there is reason to think that not everyone was asked this question.
1900 to 1930 Censuses. In 1900, the census asked both place of birth and if a person was naturalized. The 1910 census basically asks the same questions as the 1900 census, which includes parents’ place of birth. However, the IPUMS website states that actual citizenship information is only available for men 21 and older in 1900 and again in 1910 and our analysis of the raw data that IPUMS provides confirm this is the case. In addition to place of birth, the 1920 census asked all persons whether they were naturalized or an alien, and further asked naturalized citizens their year of naturalization, so it is possible to distinguish all naturalized citizens and even non-citizens among the foreign-born for the first time in a census for which the raw data is still available. In 1930 the census asked if individuals were naturalized and their year of immigration in addition to place of birth.
1940 to 1960 Censuses. The 1940 census was the first to introduce the so called “long form”, which was sent to about 5 percent of households and included questions in addition to the basic questions the entire population was asked. Citizenship and place of birth were asked of anyone in both the short and long forms in 1940, allowing respondents for the first time to record if they were a naturalized citizen or a non-citizen in one question. They could also indicate for the first time if they were a U.S. citizen born abroad, presumably to American citizen parents. This makes the 1940 census very similar to every census until 2010, when all immigration-related questions were dropped, except for 1960. From 1940 to 2000, excluding 1960, U.S.-born citizens, naturalized citizens, citizens born abroad of American parents, and non-citizens all can be identified. In 1950 all persons were again asked their place of birth. The foreign-born were also asked if they had been naturalized. In 1960, 25 percent of the population received the “long form”, which asked about place of birth. Unlike prior censuses, no questions on citizenship or naturalization or year of arrival in the United States were included in either the short or long forms. Though very little nativity information was collected in 1960, the inclusion of place of birth makes it possible to determine the size of the foreign-born population.
1970 Census. In 1970, the census was more complicated than any prior census in terms of sub-samples of the population receiving forms of different lengths. The shortest form was received by 80 percent of the population. A subgroup of households (20 percent) received longer forms. There were two different long forms, with some overlapping questions. As it relates to immigration, both the 15-percent long form and the 5-percent long form asked about place of birth. The 15-percent long form also asked about parents’ place of birth. Citizenship was not included on the 15-percent form. However, the 5-percent long form asked about citizenship (including identifying those born abroad to American citizen parents) and year of immigration, but not about parents’ place of birth or language.
1980 to 2000 Censuses. The 1980 census had only one long form, sent to approximately 16 percent of the population. The 1980 long form asked about place of birth and citizenship of those born outside of the United States. Year of immigration was also included, though birthplaces of mother and father were dropped from this and all subsequent censuses, though ancestry was added. The 1990 census and the 2000 census both employed a long form sent to about 16 percent of households that included place of birth. The 1980 census included the most detailed citizenship question used up to that time. The citizenship question in 1990 allowed for five responses, including born in the United States, born in Puerto Rico or a U.S. territory, born abroad of American parents, naturalized citizen, and not a citizen. These five responses are the same as found in the American Community Survey (ACS) from 2000 to the present and the Current Population Survey (CPS) since 1994, which are now the two primary sources of information on the foreign-born in the United States because 2000 was the last census to ask about citizenship or place of birth.
The American Community Survey. The Census Bureau decided to, in effect, to replace the census long form at the time of each census with a very large sample called the American Community Survey (ACS) on an annual basis. The ACS has basically all the information from the 2000 census long-form. In 2010 and 2020, no question related to nativity was included in the census. The ACS was fully implemented by 2005 and began to include those in institutions in 2006. The survey includes basically the same question on citizenship as the 1990 and 2000 censuses, with five possible responses. In addition, the ACS also includes questions on place birth and year of arrival, though no information on parents’ place of birth is included.
The Current Population Survey. The Current Population Survey (CPS), sometimes informally called the household survey, is collected by the Census Bureau for the Bureau of Labor Statistics to measure employment. It began to ask about citizenship starting in January 1994. The CPS also collects information on year of immigration, place of birth, and parental place of birth. However, the CPS uses a different approach from the ACS and the census long forms of the past. The CPS combines responses to birth and citizenship to determine the foreign-born population. The CPS assumes all respondents whose place of birth is the United States or outlying areas of the United States, or whose parents who were born in the United States are native-born citizens. These individuals are not asked their citizenship. The rest of the population is asked “are you a citizen of the United States?” When results are processed by the bureau, responses to place of birth, parents’ place of birth, and citizenship are combined to produce a variable that is very much like the citizenship variable in the 1990 and 2000 censuses long forms and the ACS, with its five responses. Although collected in a slightly different manner as the ACS, estimates of the foreign-born in the CPS are assumed to be comparable to the ACS and prior censuses, though the CPS, unlike the ACS, does not include the institutionalized.10
End Notes
1 In all 16 states the increase was statistically significant using a 90 percent confidence level.
2 The term “immigrant” has a specific meaning in U.S. immigration law, which is all those inspected and admitted as lawful permanent residents (green card holders). In this analysis, we use the term “immigrant” in the non-technical sense to mean all those who were not U.S. citizens at birth.
3 The 2020 ACS showed only 43.5 million foreign-born residents, down 1.4 million from 2019. However, the Census Bureau reports that it does not have confidence in the 2020 ACS due to disruptions in data collection caused by the pandemic. Throughout this report we use an average of the 2019 and 2021 ACS to measure the size of the foreign-born in 2020. This approach creates a more plausible foreign-born population of 45.1 million for that year.
4 The primary purpose of the survey is to collect information about the U.S. labor market, such as the unemployment rate. Starting in 1994, questions about citizenship, country of birth, and year of arrival were added.
5 The BLS reports that if the new weights are applied back to the December 2024 CPS, it adds 2.87 million people to the 16-plus population in the United States. The BLS is very clear that the increase in the population was due to the bureau’s new, dramatically higher estimate of migration. Being foreign-born is not a control variable (e.g. race, age, and sex) and is therefore allowed to vary in the survey based on responses, like the unemployment rate. However, being foreign-born is correlated with race. When the data was weighted to reflect the Census Bureau’s new, much higher estimate of net international migration, it significantly increased Asians and Hispanics in the survey, which in turn increases the foreign-born in the survey as well since being foreign-born is highly correlated with being Asian or Hispanic.
6 While the monthly CPS is a very large survey of about 110,000 individuals, the margins of error shown in this report are based on standard errors calculated using parameter estimates and state inflation factors provided by the Census Bureau, which account for the complex survey design of the CPS.
7 The regional populations shown in Figures 1 through 7 include the territories of those regions before they became states, though the territorial populations are typically very small.
8 The figures for regions come directly from the U.S. Census Bureau website, Table 14, “Nativity of the Population, for Regions, Divisions, and States: 1850 to 2000”.
9 The changes in the absolute and relative sizes of the regions have been enormous. For example, the Northeast accounted for 37 percent of the total U.S. population in 1850, but by 1900 it was 28 percent, and it is only 17 percent today. In contrast, the West was only a tiny share of the nation’s total population in the 1800s and only reached 5 percent in 1900. It was still only 13 percent in 1950, compared to nearly 24 percent today.
10 The CPS does not include the institutionalized population, which is included in the decennial census and American Community Survey (ACS), used to measure the foreign-born population from 1850 to 2020. The institutionalized are primarily those in nursing homes, prisons, and jails. We can gauge the impact of including the institutionalized when calculating the foreign-born percentage by looking at the public-use 2023 ACS, which shows that when those in institutions are excluded, it changes the foreign-born share of the total population by less than one-tenth of 1 percent. This small increase is because immigrants are a somewhat smaller share of the institutionalized than they are of the non-institutionalized. However, the institutionalized population is not very large relative to the overall population, so it makes relatively little difference to the number of foreign-born residents or their share of the total population.

