The Fertility of Immigrants and Natives in the United States, 2023
- External Source
admin
- 0
- 43 minutes read

This analysis of the 2023 American Community Survey (ACS) collected by the Census Bureau shows that the fertility of both immigrants (also called the foreign-born) and the U.S.-born has declined in the last 15 years. The fertility of immigrant women is somewhat higher than that of the U.S.-born; however, the presence of immigrants has only a small impact on raising overall fertility in the United States. The small impact on overall fertility rates is one of the reasons immigration does not significantly undo population aging in the United States. There is also some evidence that immigration may actually lower the fertility of the U.S.-born, perhaps by driving up housing costs, thereby reducing or potentially erasing immigration’s small positive impact on overall U.S. fertility. Although immigration does not have a large impact on overall fertility or population aging, it does add significantly to the overall size of the U.S. population.
Among the findings:
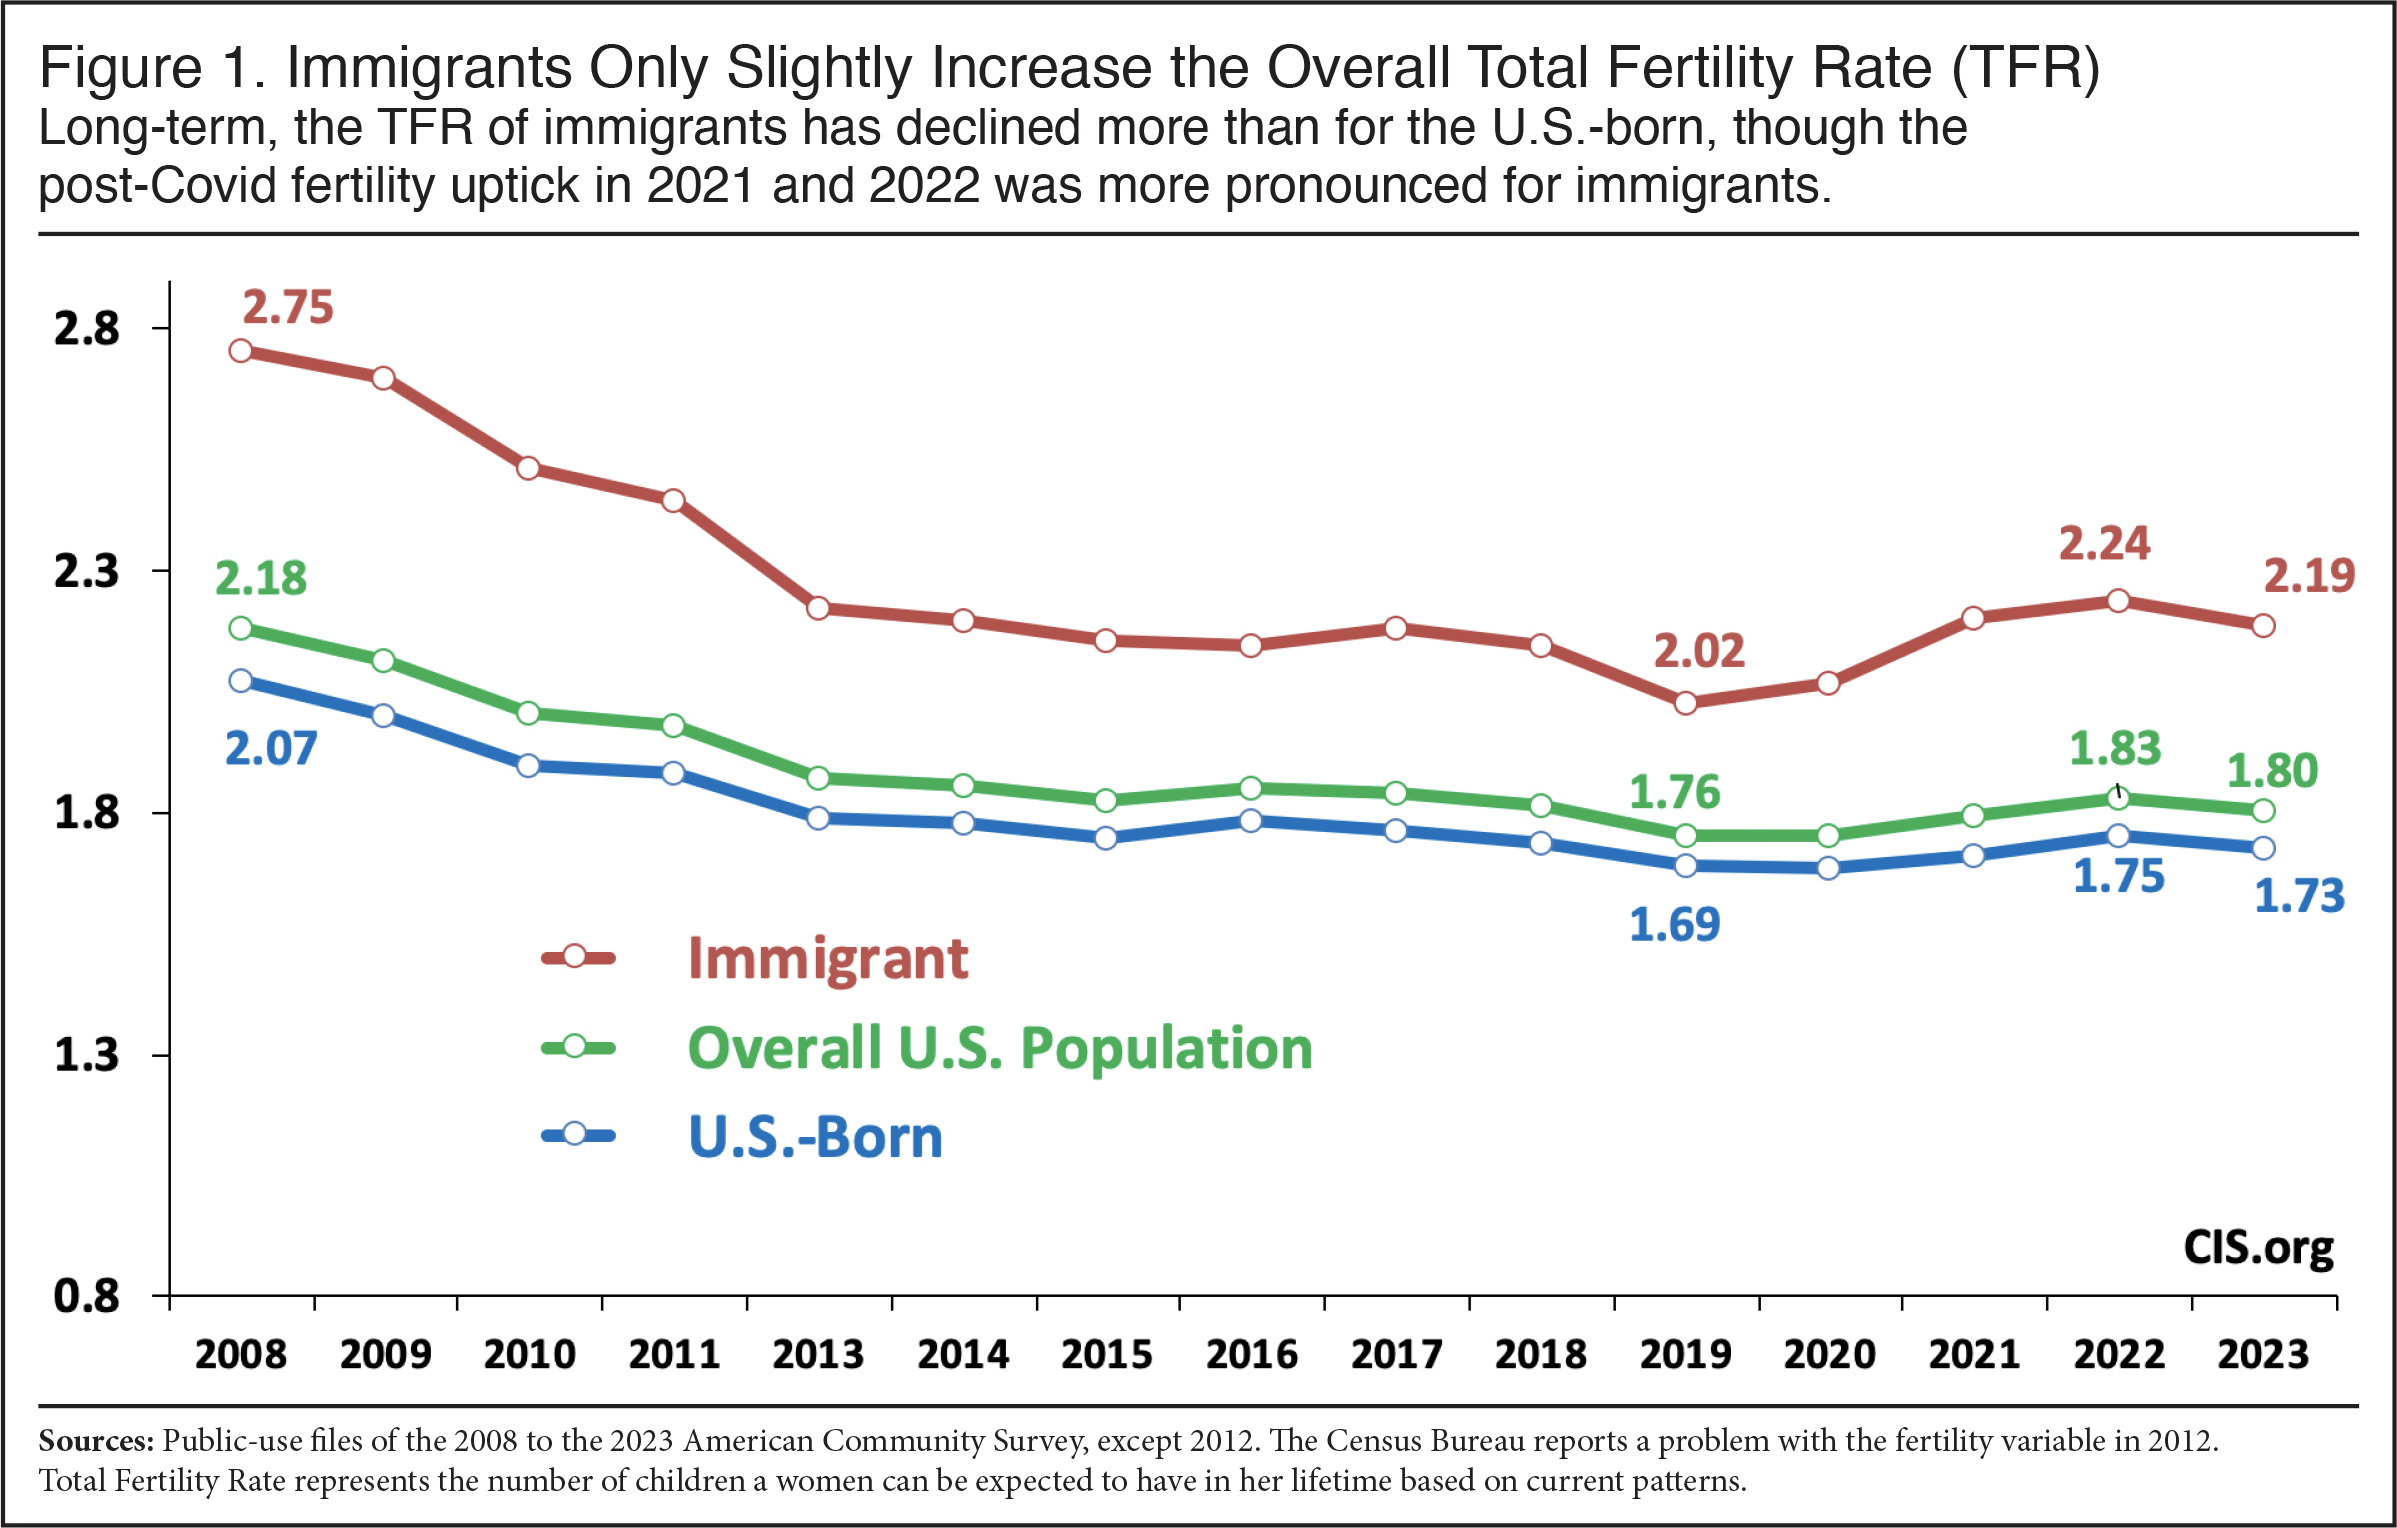
- In 2023, the overall total fertility rate (TFR) in the United States, the overall average number of children a woman will have in her lifetime given current trends, was 1.8 children, 2.19 for immigrants and 1.73 for the U.S.-born.
- This means the presence of immigrants raised the nation’s overall TFR by about .08 children or 4.5 percent.
- The TFR of immigrants has declined somewhat more than that of the U.S.-born since 2008. In 2023, it was .57 lower than it was in 2008, while that of the U.S.-born was .35 lower.
- Immigration’s ability to increase fertility is also limited by the relatively low fertility of every major racial group among the U.S.-born. The TFR of U.S.-born Hispanics is 1.81; it is 1.53 for Asians, 1.65 for blacks, and 1.75 for whites.
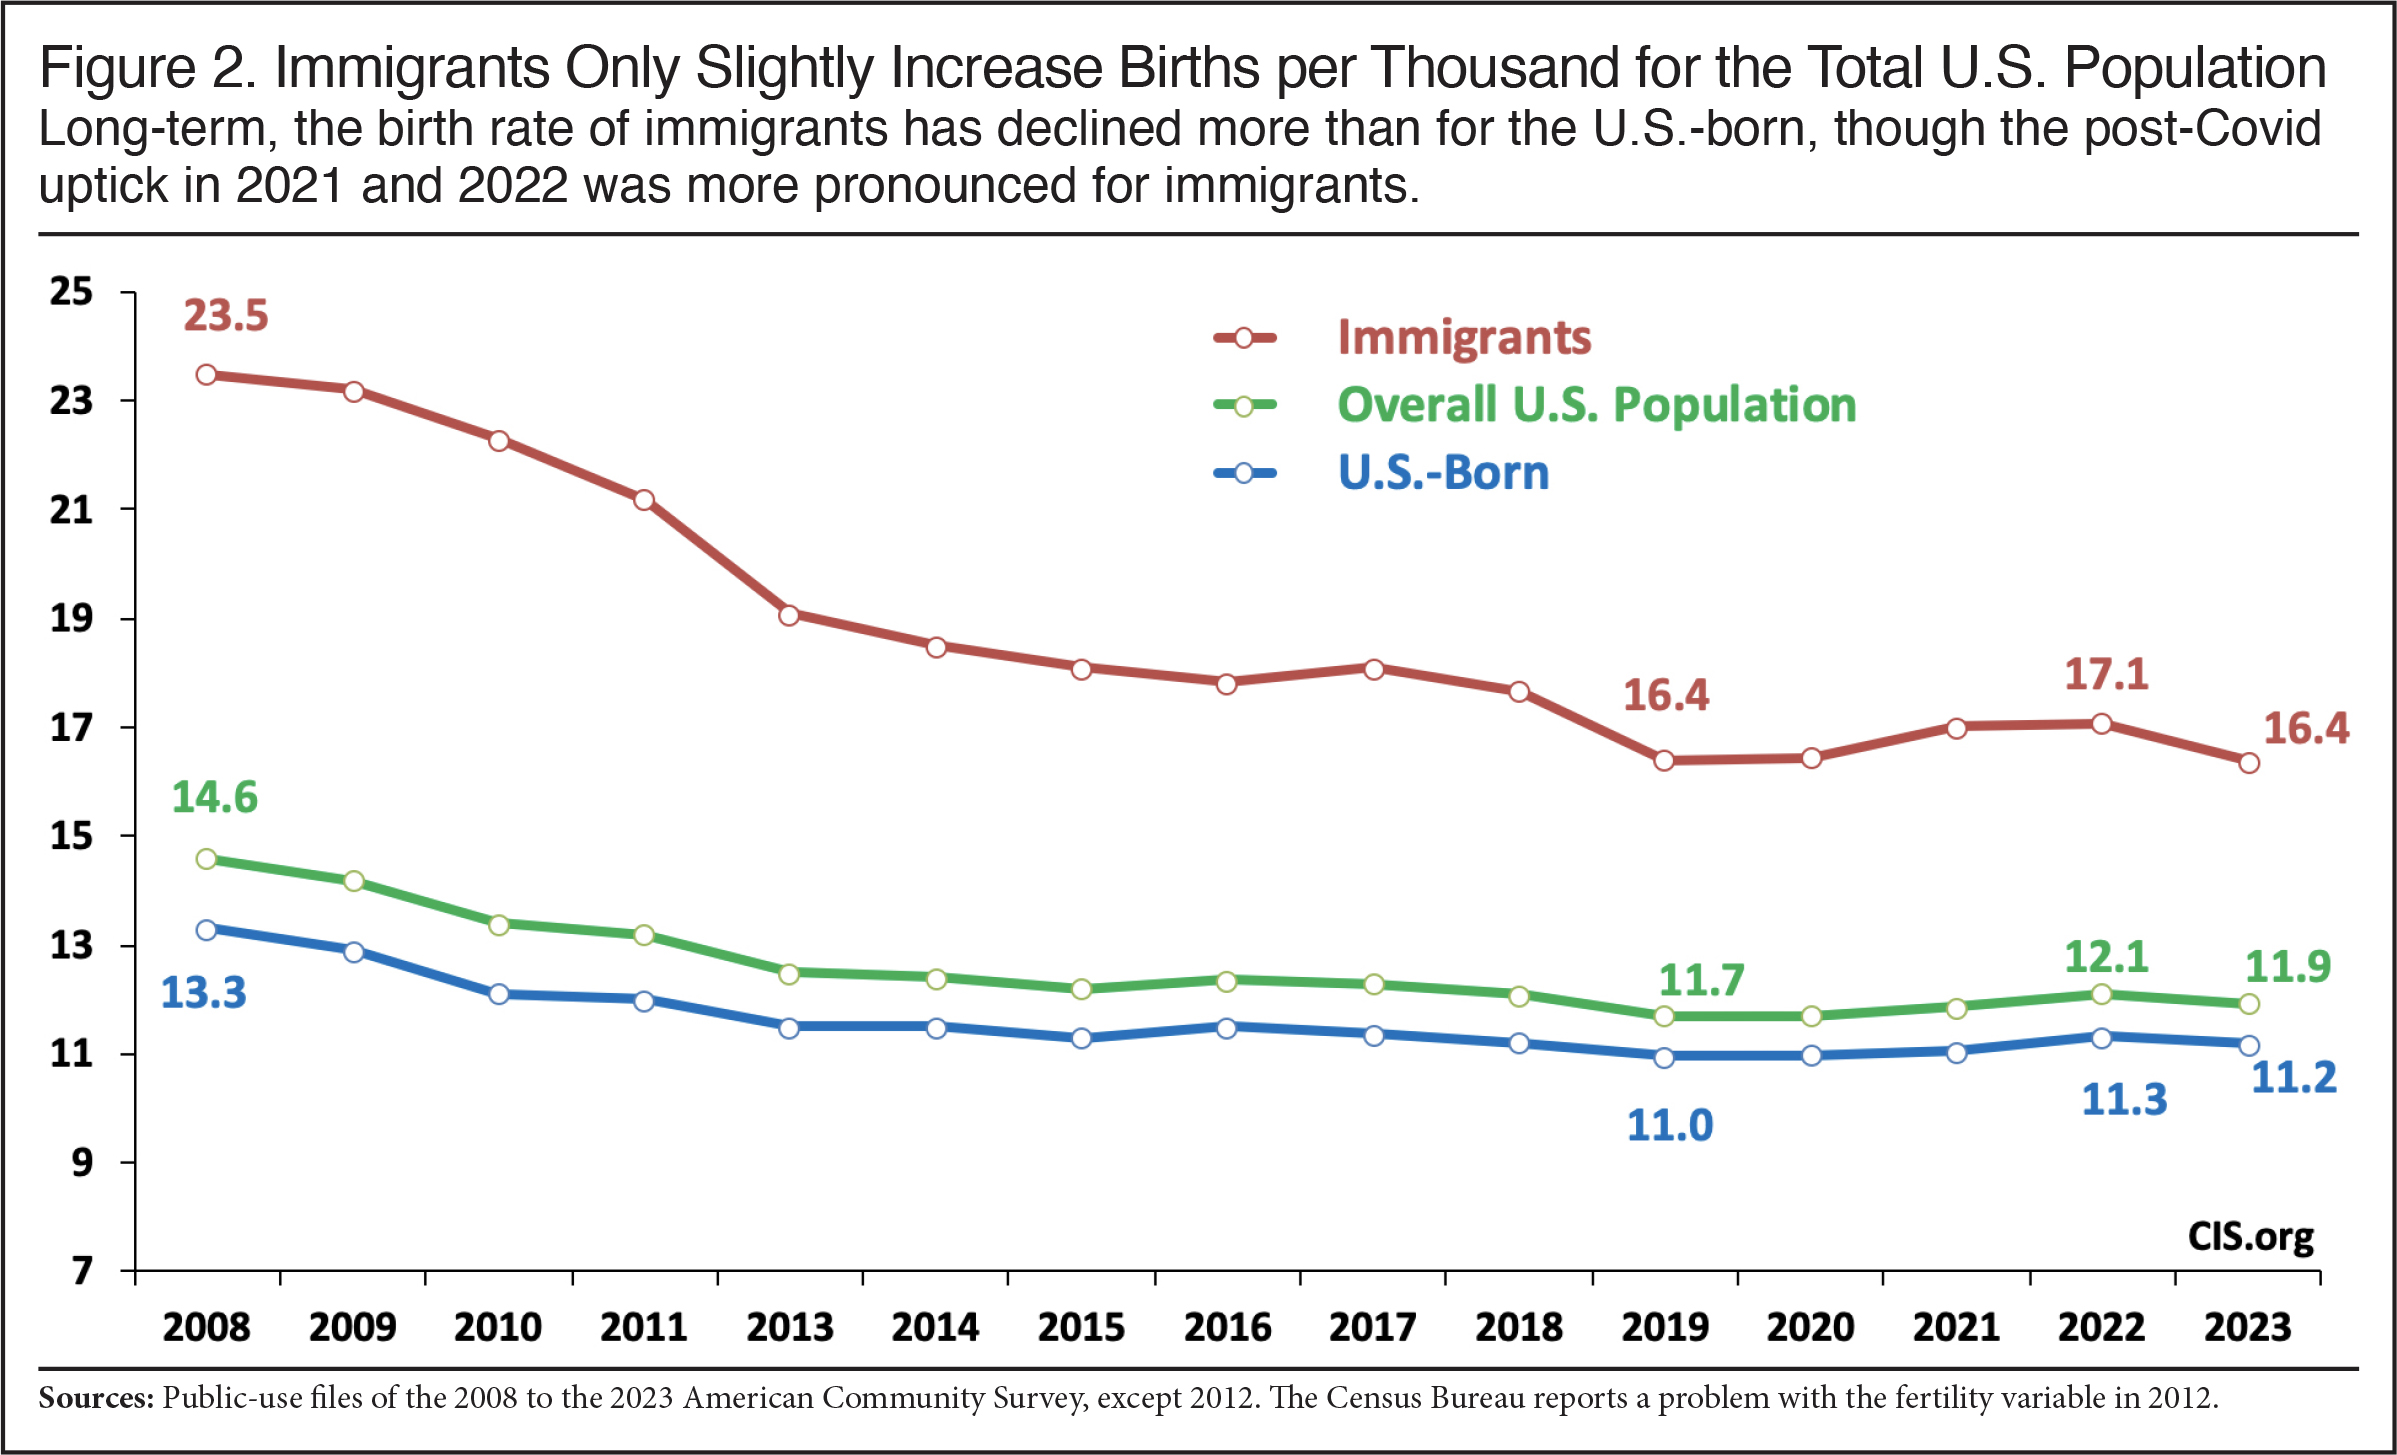
- Compared to TFR, immigration does increase births per thousand for the entire U.S. population (men, women, and children) somewhat more, from 11.2 births per thousand without immigrants to 11.9 births per thousand with immigrants — a 6.6 percent increase.
- The impact is still quite small because even though immigrants have somewhat higher fertility and are also somewhat more likely to be of reproductive age, the fertility differences with the U.S.-born are not that large and immigration adds to the entire population, not just women of reproductive age.
- As is true of TFR, births per thousand for immigrants has declined more than for the U.S.-born. For immigrants, it has fallen from 23.5 births in 2008 to 16.4 births in 2023. For the U.S.-born, births per thousand fell from 13.3 to 11.2 over the same period.
- Focusing only on births per thousand for women of reproductive age (15 to 50) also shows the small impact from immigration. When immigrants are included, births per thousand for women in 2023 was 51.2 and without them it was 49.3 — a 3.9 percent increase.
- Even if the number of immigrant women of reproductive age doubled, along with births to this population, it would still only raise the birth rate for all women (15 to 50) by about one birth per thousand, or 2.7 percent.1
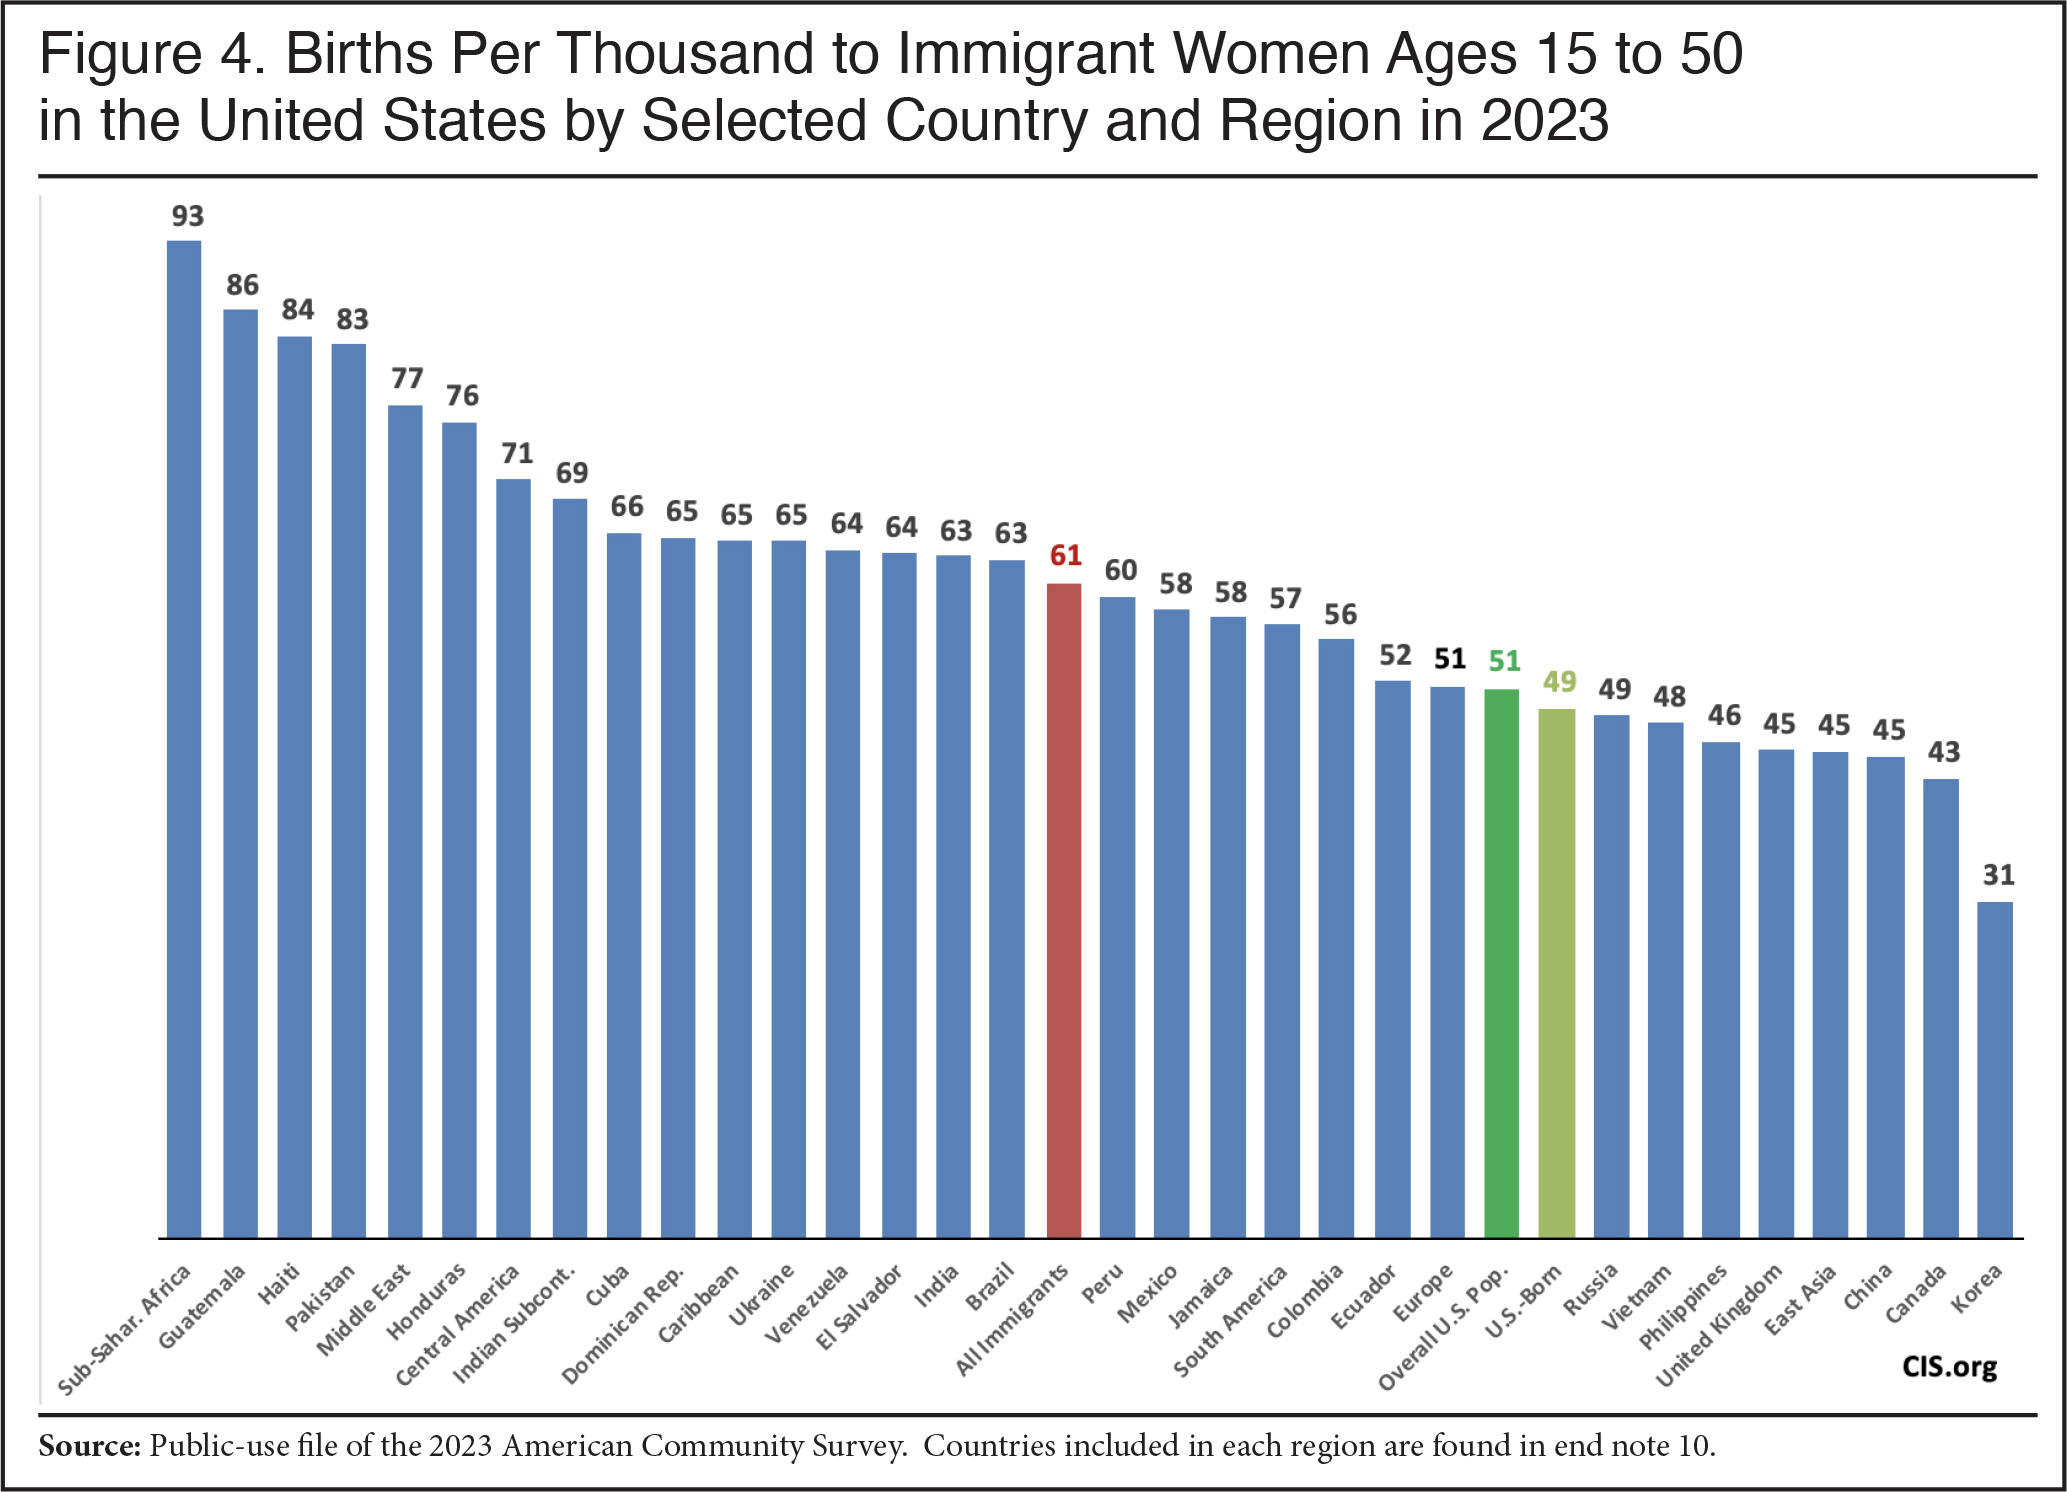
- The immigrants in the United States with the highest birth rates are those from Sub-Saharan Africa, the Middle East, and Central America.
- Consistent with other research on the impact of the presence of immigrants and the fertility of the U.S.-born, we find a negative correlation between the immigrant share of the population and the fertility rate of U.S.-born women in the nation’s largest metropolitan areas.
- There are a number of possible reasons why immigration might lower the fertility of the U.S.-born. It may drive up housing costs for families with children, lower wages, or strain public services such as schools. There is some research that also indicates that by increasing diversity, immigration may reduce marriage and fertility as well.
- Although immigration has only a small impact on overall fertility and aging, it has a significant impact on population size. Based on ACS data, between 2021 and 2023 the immigrant population grew by 2.52 million, equal to 83 percent of the total increase in the U.S. population.2
Introduction
There is no question that America is aging due to both a decline in fertility rates and increases in life expectancy. Former Florida governor and 2016 presidential candidate Jeb Bush argued that immigrants can fundamentally change this fact, partly because “immigrants are more fertile”. It is true that immigrants have more children on average than the native-born. But as this analysis will show, the impact of immigrants on the nation’s overall fertility rate (native and immigrant together) is quite modest no matter how fertility is measured. Therefore, it would be incorrect to argue that the fertility of immigrants “rebuilds the demographic pyramid”, as Bush argued. We use the term “immigrant” in this report synonymously with “foreign-born”. The foreign-born are all individuals who were not U.S. citizens at birth, including illegal immigrants.3 We use the terms, “U.S.-born” and “native” to represent all those who were American citizens at birth.4
This report uses the public-use files of the 2006 to 2023 American Community Surveys (ACS), excluding 2012, to calculate TFRs and other measures of fertility.5 The ACS can be used to study the fertility of immigrants and the U.S.-born because the survey asks women 15-50 if they had a child in the last year and it also identifies both immigrants and the U.S.-born. The other data often used to calculate fertility rates is from the National Vital Statistics System (NVSS), which is a joint effort by the National Center for Health Statistics (NCHS) and state and local governments based on birth certificate information. Unfortunately, birth certificates do not ask about citizenship, so NVSS data cannot be used to directly measure births to the foreign born, as it is normally defined, in the same way as the ACS.6 For reasons that are not entirely clear, NVSS data in recent years shows fewer births than the ACS. In the appendix at the end of this report we discuss the differences between the two data sources.
The Impact of Immigration on the Total Fertility Rate
The Total Fertility Rate (TFR). One of the most common ways to measure fertility is the total fertility rate (TFR). The Census Bureau defines TFR as “the average number of children that would be born per woman if all women lived to the end of their childbearing years and bore children according to a given set of age-specific fertility rates”. One way to think about the TFR is that it assumes that when women who are, for example, currently ages 20-24 move into the 25-29 age group, they will have the same fertility as women in that age group today. In other words, the TFR uses current fertility rates by age cohort to estimate the fertility of today’s women during their lifetimes.7 Table 1 shows the calculations used to generate TFRs using the ACS.
As a general rule, a TFR of at least 2.1 children per woman is necessary to maintain the current population in the long run — putting aside people entering or leaving a country. Hence a TFR of 2.1 is referred to as replacement-level fertility.8 Figure 1 reports the TFR of immigrants and the U.S.-born based on the ACS. In 2008, immigrant women had a TFR of 2.75 children; by 2023 it was 2.19. For U.S.-born women, it was 2.07 in 2008 and 1.73 in 2023. As the figure shows, there was a modest increase in fertility for both natives and the foreign-born after Covid in 2021 and 2022, which was slightly more pronounced for immigrants. But by 2023 it had declined for both groups, though it was still slightly above the 2019 level in 2023. Perhaps most important, without immigrants, the TFR of the U.S. population would be 1.726, the rate for the U.S.-born. With immigrants, the overall TFR is 1.804. The presence of immigrants raised the nation’s overall TFR in 2023 by a little less than .08 children, or 4.5 percent.
 |
TFRs by Race. Table 2 shows the fertility rate for the foreign-born and natives by race, with Hispanics (of any race) shown separately and excluded from other racial categories. The top of the table shows that, as is the case for the country as whole, the inclusion of immigrants does not raise the fertility of any group to replacement level. The middle of the table shows that among immigrants, fertility declined from 2008 to 2019 for all groups. Hispanic immigrant fertility declined the most. Black immigrants now have the highest fertility of any immigrant group shown in the table.9
All groups experienced a post-Covid uptick in fertility, but in 2023 fertility declined for all groups. Despite the drop in 2023, fertility for all immigrants remained above the level in 2019, though Asian immigrant fertility was about the same and has been below replacement level for a decade and a half. The bottom of the table shows the same basic pattern for the U.S.-born — a significant decline from 2008 to 2019, with some rebound in 2021 and 2022 and a falloff in 2023. American-born Hispanics had slightly higher fertility than the other major U.S.-born groups in 2023 and U.S.-born Asians have the lowest fertility. But in general, U.S.-born whites, blacks, and Hispanics all have similar TFRs, which is below replacement level and has been for some time.
The Impact of Immigration on Births per Thousand
Births Per Thousand for the Total Population. In addition to total fertility rates, demographers often measure fertility by calculating births per thousand. This is sometimes referred to as the General Fertility Rate or GFR. In the discussion that follows, we report the GFR for the entire population, but it is most often used for specific groups, like women of reproductive age. The primary advantage of GFR is that it is a straightforward and easy way to think about fertility. Figure 2 shows births per thousand for the entire U.S. population — men, women, and children. Table 3 provides more detailed information. As is true with TFRs, immigrant GFR has declined more than for the U.S.-born. For the foreign-born overall, births per thousand have fallen from 23.5 in 2008 to 16.4 in 2023 — a decline of 7.1 births, or 30.2 percent. For the U.S.-born, births per thousand fell from 13.3 to 11.2 over the same period — a decline of 2.1 births, or 16.1 percent. In 2023, the GFR for the whole U.S. population was 11.9 with immigrants and 11.2 without them — a 6.6 percent increase. This is the largest impact that can be measured from immigration on the nation’s fertility, yet it is still very modest.
 |
Why the Impact Is Small. As we have seen, foreign-born women in their reproductive years have somewhat higher fertility rates. It is also true that foreign-born women are more likely to be of reproductive age relative to the U.S.-born. The reason the effect is still so modest is that in both cases the differences with the U.S.-born are not very large. Immigration adds to the entire population, so a very large share of immigrants are not women in their childbearing years. In the 2023 ACS, only 27 percent of the total foreign-born population were women ages 15 to 50. Moreover, 18 percent of all immigrants are 65 and older, which is almost exactly the same as the U.S.-born. Immigrants are people; and, as in any human population, the overwhelming majority are not women of reproductive age, which is the key population that determines fertility. This basic reality coupled with the fact that the fertility of foreign-born women is not that much higher than that of the U.S.-born means they can have only a modest impact on the nation’s overall birth rate.
Births to Women 15 to 50. Demographers often measure fertility for women 15 to 44, as the vast majority of births occur to women in this age group. However, we report births per thousand, or the GFR, for women 15 to 50 in Figure 3 because the ACS asks women up to age 50 if they have had a child in the last year. Moreover, the Census Bureau has reported fertility for women up to age 50 in some of its publications. Doing so provides a more complete picture of fertility in modern America, as there are now a significant number of births to women over age 44 — nearly 120,000 in 2023. Table 4 provides more detailed information by race for births per thousand for women 15 to 50.
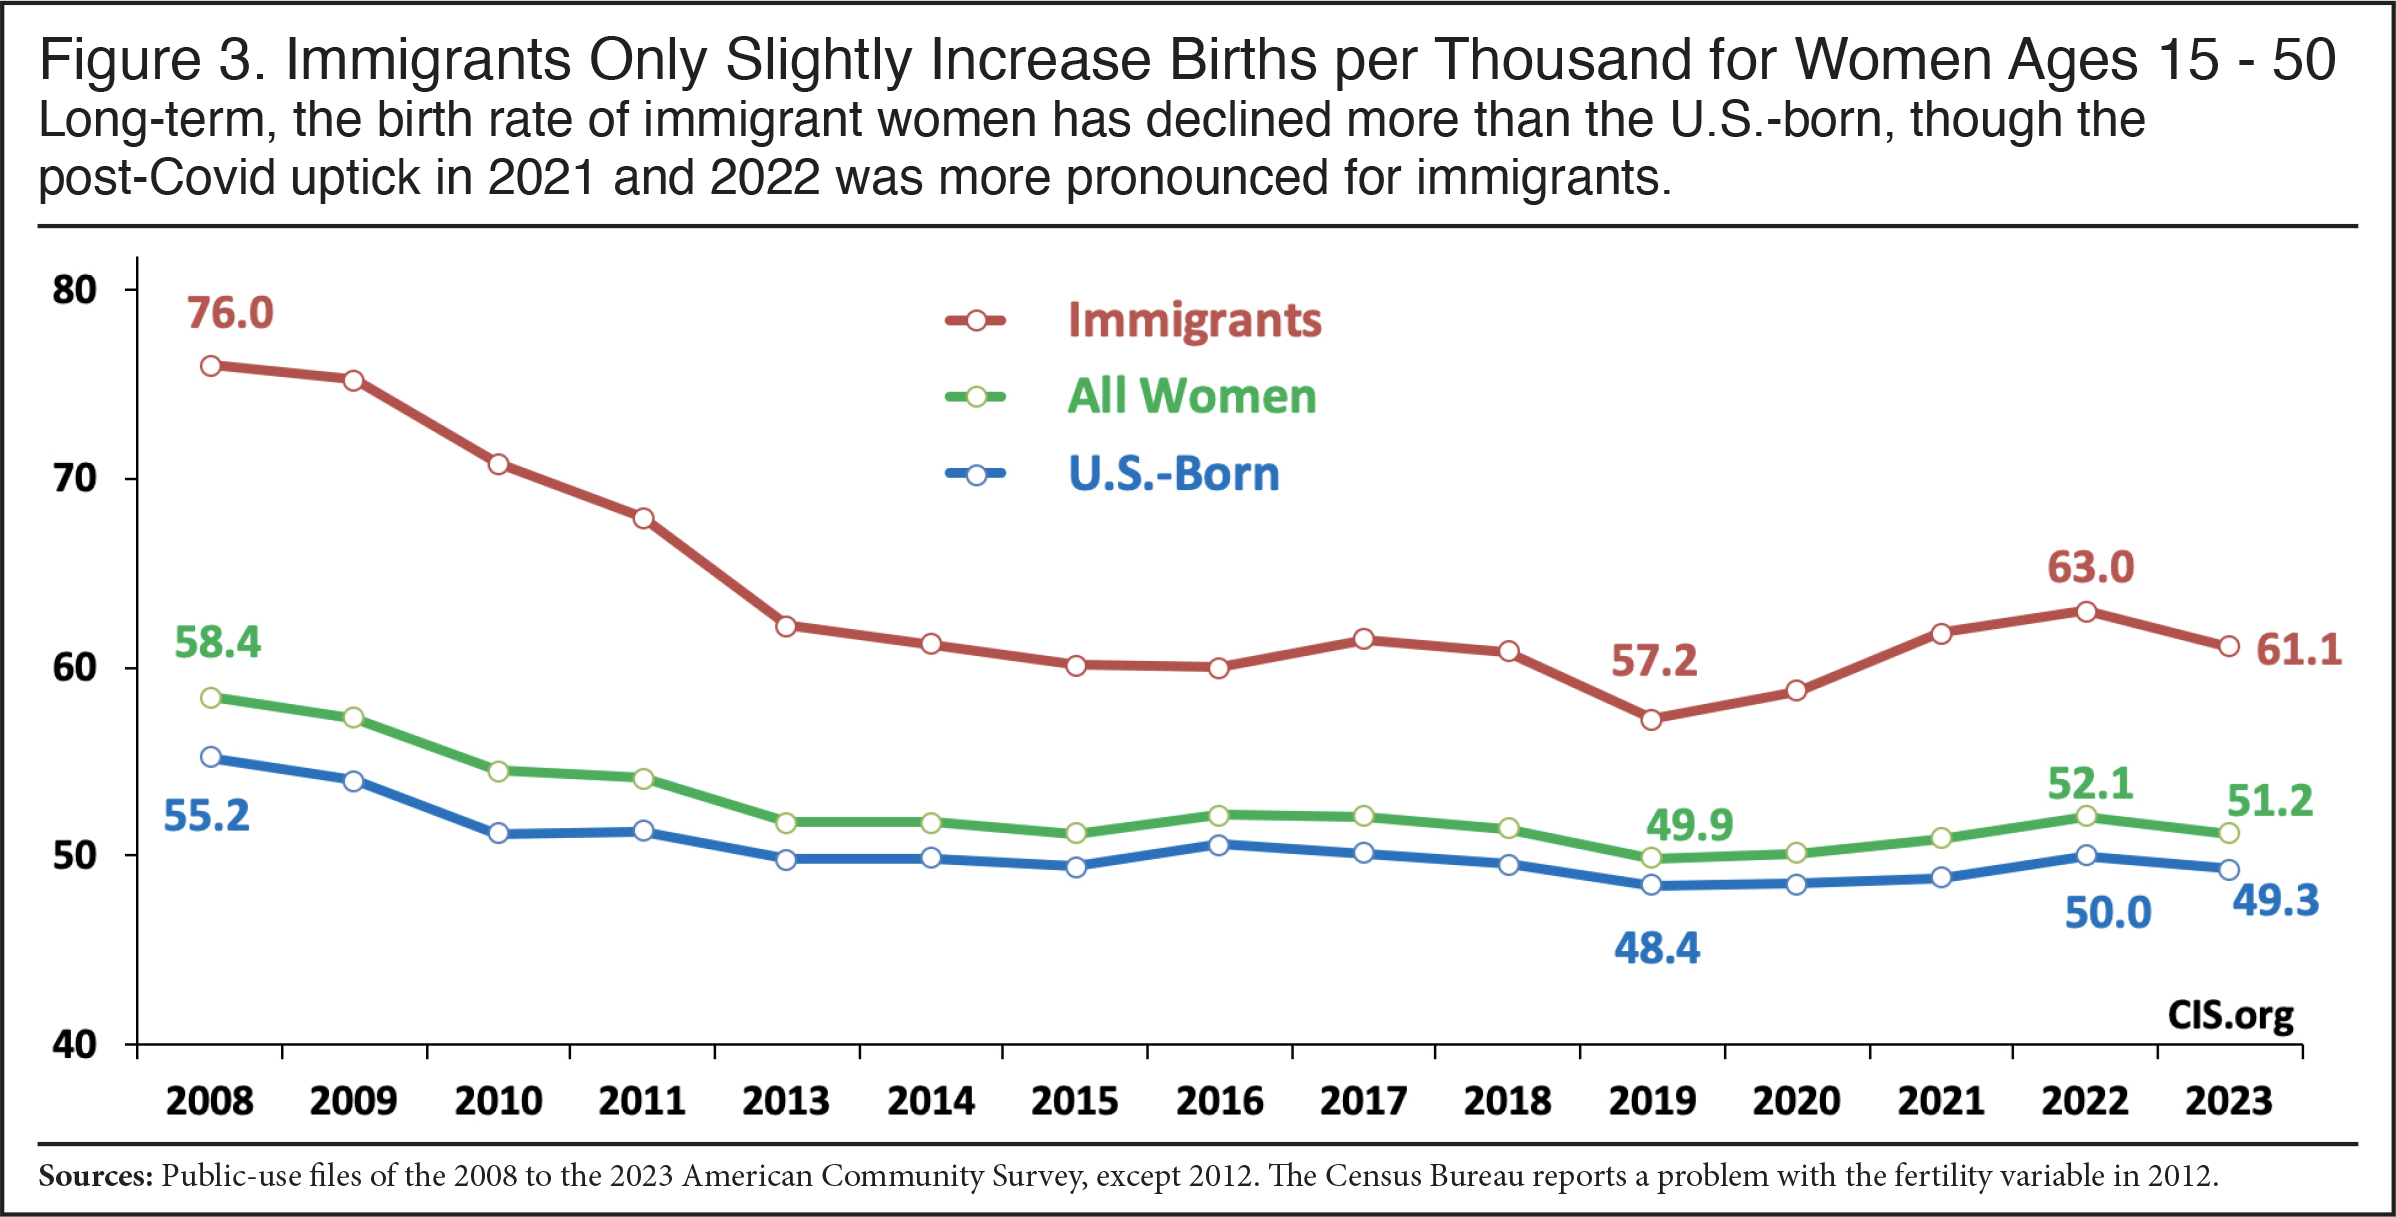 |
Like the other measures of fertility already discussed, Figure 3 shows that the GFR for immigrant women 15-50 has declined more than the rate for the U.S.-born. The birth rate for immigrant women in this age group declined from 76 births per thousand in 2008 to 61.1 per thousand in 2023 — a decline of 15 births, or 19.7 percent. For the U.S.-born, the birth rate for women in this age group declined from 55.2 to 49.3 births per thousand, or 10.8 percent over this time period. The post-Covid uptick in fertility was measurable for both groups, though somewhat higher for immigrants, but it did not really change the overall long-term trend of declining fertility. Perhaps most important, Figure 3 shows that the presence of immigrants increased fertility in the United States for all women 15 to 50 by just 1.9 births per thousand or 3.9 percent. As is true both when we look at TFRs and the GFR for the entire population, the inclusion of the foreign-born has only a small overall impact on births per thousand for women 15 to 50. The same basic pattern holds when we focus on the birth rate for women in the narrower age range of 15 to 44 as shown in Table 5.
Fertility by Sending Region and Country. Figure 4 shows births per thousand by sending regions and for selected countries for immigrants. It shows immigrants from Africa and the Middle East tend to have the highest fertility rates in the United States, while those from Europe and East Asia tend to have the lowest.10 While immigrants from most of the countries and regions listed have birth rates higher than the U.S.-born, it must be remembered that some of the foreign-born with the highest fertility have relatively small immigrant populations, so they have only a tiny impact on overall fertility in the United States. Further, there are some sending countries whose immigrants have somewhat lower fertility than natives.
 |
The Impact of Immigration on U.S.-Born Fertility
This analysis has primarily focused on the direct effect immigrants have on raising the fertility rate in the United States by changing national averages. However, it is possible that immigration has an indirect effect as well. Immigration may create conditions that encourage or discourage American-born women from having children. There are many possible ways this might happen. Perhaps the most obvious way immigration could impact the decision to bear children is by creating uncertainty about the economic prospects of U.S.-born women or their partners. Sobotka et al.’s review of the literature found that while many factors impact the decision to bear children, declining GDP levels, falling consumer confidence, and rising unemployment all tend to lower birth rates.
There is a long and complex debate about immigration’s effect on the labor market outcomes of the native-born that need not be summarized here. The key issue is that if immigration reduces the economic well-being of some U.S.-born workers either by reducing income or employment, or by driving up the costs of key goods and services, then it could discourage them from having children. If this is the case, then measuring immigration’s impact is not simply a matter of calculating what overall fertility would be with and without immigrants.
Prior Research Showing Immigration Reduces Fertility. Kelvin K. C. Seah’s 2018 study of the 1980 Mariel boatlift to Miami, Fla., found that the increase in immigrants in the city significantly reduced the fertility of the U.S.-born in the short term. The primary impact was on women who lived in rental housing. This suggests that immigration reduces fertility in receiving communities by making it more difficult for younger, less affluent couples to move into larger or owner-occupied housing.
A recent working paper by David Solomon found that as diversity increases in an area, the number of children that residents have decreases.11 The relationship holds across many places and time periods, and under a variety of model specifications. Solomon suggests one possible explanation for this is “homophily”. This is the tendency for people from similar backgrounds to associate with each other. The extent to which diversity makes it harder to find a marriage partner of the same ethnicity could be a reason why diversity reduces fertility. Solomon also cites well known political scientist Robert Putnam, who has observed lower civic engagement in more diverse communities, which also may reduce the ability to find a mate and have children.
Based on Soloman’s work, our colleague Jason Richwine recently calculated that based on how much immigration has increased diversity, it is possible that the reduction this causes in native fertility could be enough to entirely offset the modest increase in overall TFR rates caused by immigrants. Since immigration only has a small impact on overall fertility, the negative impact it has on native fertility does not have to be that large to erase the small positive impact on the overall average in the United States.
Housing Costs. Solomon’s suggestion that diversity reduces fertility may well be the mechanism by which immigration reduces fertility. Another way immigration might impact native fertility is through reducing housing affordability. Some opinion writers have argued that the recent surge in immigration is making housing less affordable. There is certainly prior research showing immigration drives up housing costs. In a 2007 study, Albert Saiz found that “An immigration inflow equal to 1% of a city’s population is associated with increases in average rents and housing values of about 1%.” A 2017 study by Mussa, Nwaogu, and Pozo also found that the influx of immigrants into a metropolitan area drives up rents and housing prices. There is also evidence in the immigrant-receiving countries of Australia and Canada, immigration increases housing prices. Looking across 21 different countries from 2007 to 2014, another study also found evidence that the arrival of immigrants significantly increases housing costs.12 If immigration does reduce the fertility of the American-born population it seems very likely that higher housing prices is one of the primary reasons.
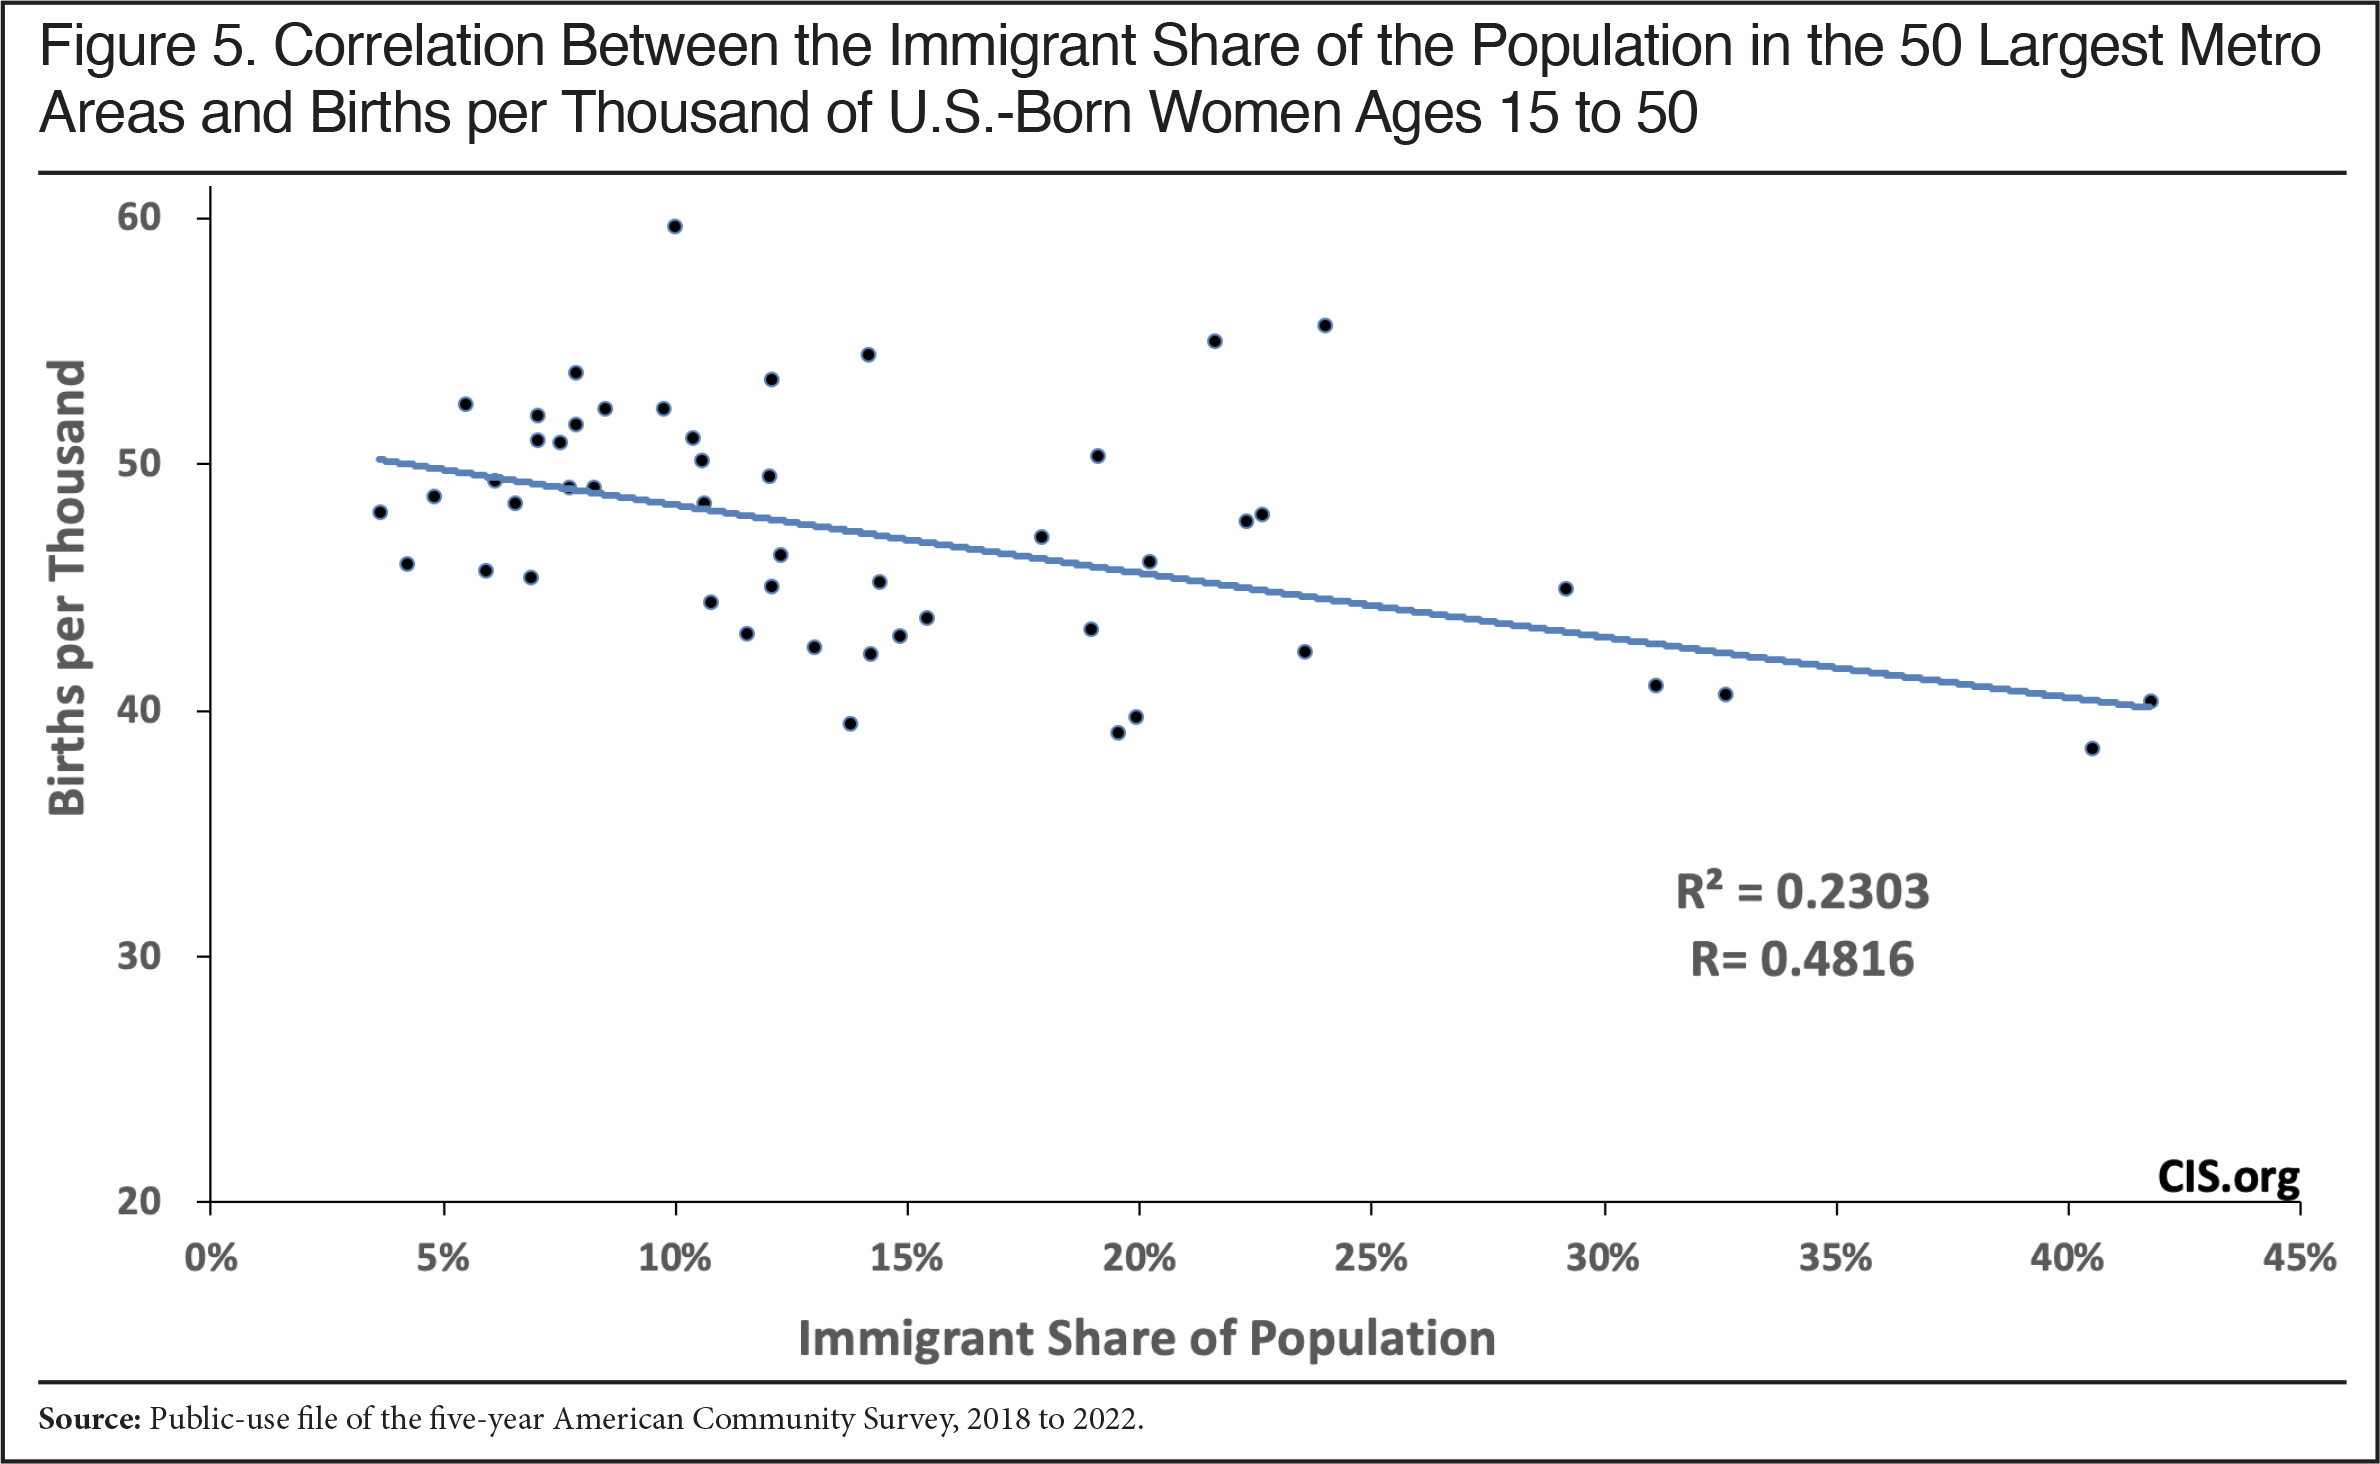
Negative Correlation Between Immigration and Fertility. The most straightforward way to measure immigration’s impact on fertility using the ACS is to look for correlations between the presence of immigrants in an area and the fertility of the native-born. The best unit of analysis readily available in the ACS for this type of research is the Metropolitan Statistical Area (MSA). Metro areas are often used for this kind of analysis because they best approximate a labor and housing market, at least as measured in Census Bureau data. Figure 5 shows a scatter plot of the correlation between the immigrant share of the population in the 50 largest MSAs and births per thousand of U.S.-born women ages 15 to 50. The plot indicates that, as the immigrant share increases, native fertility falls. The correlation is -.48. This is a reasonably strong relationship.
 |
While native fertility does seem to be lower in higher immigration cities, a simple correlation of this kind is by no means definitive. Significantly more analysis would be necessary to confirm this finding given the enormous number of factors that impact fertility decisions. The correlation here is only for the nation’s 50 largest metro areas, where statistics from the ACS are the most robust. Although these cities account for about 54 percent of the total U.S. population, when we expand the analysis to smaller MSAs the relationship is not nearly as strong. The sample size of immigrants or U.S.-born women of reproductive age is quite modest in smaller MSAs so it is unclear if the lack of a strong relationship between immigration and fertility is due to sampling error or that the relationship does not hold in smaller MSAs. All this said, the finding of a negative relationship between fertility of the U.S.-born and the immigrant share of the local population is consistent with the other research cited above and is certainly plausible.
Conclusion
The idea that immigrants can prevent the aging of society and “rebuild the demographic pyramid” because they are “more fertile” has an intrinsic appeal. It is tempting partly because it seems like a quick fix to problems like funding Social Security and Medicare and avoiding politically painful choices like cutting benefits, raising taxes, or increasing the retirement age. However, demographers have long known that immigrants can have only a small impact on population aging in countries like the United States. The Census Bureau’s “high” and “low” immigration scenarios also show relatively little difference in the share of the population that is of working age through 2060. In terms of fertility in 2023, immigrants’ somewhat higher fertility has only a very modest impact on the overall fertility rate no matter how fertility is measured. In 2023, the total fertility rate in the United States based on the ACS was 1.73 children per woman without immigrants and 1.8 with immigrants — less than a 5 percent increase. The reason for this is that immigrant fertility is not that much higher than the U.S.-born and as a consequence immigrants cannot significantly increase overall fertility rates in the United States.
We also find that the long-term decline in fertility has been more pronounced for the foreign-born than the U.S.-born since 2008. Though there was a modest post-Covid uptick in birth rates in 2021 and 2022, this increase had largely abated by 2023. This decline in immigrant fertility means that the small impact immigration has on the overall fertility rate in the United States, and the resulting impact on the aging of America’s population, has become smaller over time even as the immigrant population has grown.
We also discuss in this report the evidence that immigration reduces the fertility of the U.S.-born. There are several possible reasons why this may be the case. It may drive up housing costs for families with children, lower wages, or strain public services such as schools. There is some research that also indicates that by increasing diversity, immigration may reduce marriage and fertility as well. Using the ACS, there is a negative correlation in the nation’s largest metro areas between the presence of immigrants and the birth rate of U.S.-born women. The reduction in native fertility caused by immigration may be large enough to erase the modest positive effect immigrants have on overall fertility in the United States.
Putting aside the possibility that immigration reduces the fertility of natives, it is still the case that fertility is dropping around the world, including in all of the primary immigrant-sending regions. It should come as no surprise that immigrants in the United States are also having fewer children. This basic fact means that unless the number of immigrants was increased many fold, which is politically impossible and would be socially very disruptive, immigration cannot substantially increase the overall fertility rate in the United States. One can favor reduced or increased immigration for any number of reasons, but America will simply have to look elsewhere to deal with low fertility and population aging.
Appendix: The Difference Between NVSS and ACS Data
The number of births in the ACS, as measured by the share of female respondents who indicate they had a child in the prior 12 months, is significantly higher than the number of live births as reported by the National Vital Statistics System (NVSS). It is not surprising that the two sources show somewhat different numbers. But we cannot fully account for why the difference between the numbers was so much larger in 2023 than it had been in prior years. Before discussing some of the differences, it should be noted that the administrative data is not a sample. In contrast, the ACS has a margin of error of about 1.2 percent (± 42,000 in 2023), assuming a 90 percent confidence interval. This certainly accounts for some of the difference.
Factors Inflating NVSS Births Relative to the ACS. The 2023 ACS shows 3.997 million female respondents in the public-use data who indicated they had a child in the prior year. The NVSS reports 3.596 million births in the United States in 2023. The roughly 400,000 difference between what the ACS and what NVSS report is much larger than the roughly 92,000 difference between the two data sources as recently as 2019, before the pandemic. In general, since 2017 the size of the difference between the two data sources has increased with the ACS showing more births. There are two main factors that should actually cause the administrative data to show more births: First, the ACS records multiple births as a single birth, while NVSS reports them as individual births. Second, the ACS does not include births to any women who left the country or died before being surveyed, while births to such women show up in the NVSS records. Both of these factors should cause the ACS to understate births relative to the NVSS.
Factors Inflating Births in the ACS Relative to the NVSS. There are a number of factors that should cause the number of births in the ACS to exceed births in the administrative records. First, because the ACS is based on self-reporting, some number of late miscarriages or stillbirths may be recorded in the ACS, while they would not be included in the birth records. In 2023, there were about 21,000 stillbirths in total in the United States, so the number is relatively small compared to the total number of births. A larger issue is that some women who reported having a child in the ACS had them overseas and as a result the births will not show up in U.S. birth certificate records. The 2023 ACS (which reflects the population at midyear) shows 69,400 women who reported having a child in the last year who also said they arrived in the United States in 2022 or 2023. In 2019, pre-Covid, 47,441 new mothers said they arrived in 2018 and 2019.13 Some share of these births must have taken place overseas, which we think could be something like one-third to one-half based on other responses in the survey. The bottom line is that the number of women arriving in the country each year and having a child relatively soon after is not trivial and it has been increasing in recent years. But it does not appear large enough to account for the difference between the ACS and NVSS data.
One final factor to consider is that the July 1 control date of the ACS means that the survey technically reflects births in the first six months of the survey year and the last six months of the previous year. In contrast, birth records reflect all live births during each calendar year. However, it is possible to adjust for this issue. The CDC data tool makes it possible to look at the monthly data and align the number of births in the first half of one year to the second half of another so that it better matches how the ACS measures births. The NVSS shows 3.649 million births in the 12 months preceding July 1, 2023, about 53,000 more than the same data shows in calendar year 2023. The margin of error in the ACS, the possibility of over-reporting live births in the ACS, the increasing number of births that take place overseas, and the difference between the control date of the survey and NVSS’s use of calendar year all help to explain the difference between the two numbers. But we do not believe that these factors combined can fully account for the large difference between the two data sources, particularly in 2023.
There is the possibility that an increasing number of births are not being recorded in the NVSS data. An increasing number of births do take place at home. However, registration of births is still compulsory in the United States, though penalties vary by state. The NVSS claims that 99.91 percent of all births are recorded. We have no evidence that contradicts this claim.
Using NVSS Birth Data with the ACS. As already mentioned, if we line up the NVSS birth records with the ACS we get 3.649 million births in the year prior to July 1, 2023. Using the ACS, the total population in 2023 was estimated to be 334.91 million. For the country as a whole this translates into 10.9 births per thousand compared to 11.9 when using just the ACS. While not a huge difference, it is not trivial either. We are not able to match the ACS’s definition of the foreign-born with the available NVSS data so we cannot directly compare ACS and NVSS estimates of births to immigrants and the native-born. However, we can roughly approximate it using the data tool provided by Vital Statistics. We find 838,860 births to “foreign-born mothers”, though this figure includes births in the United States to mothers who are from U.S. possessions (e.g., Puerto Rico) and mothers who themselves were born in other countries to American citizen parents.14 Defining the foreign-born in this way in the 2023 ACS provides a total population of 53.525 million which then translates into 15.7 births per thousand for the overall population of immigrants, which is somewhat lower than the 16.4 births per thousand we reported above based solely on the ACS using the standard definition of foreign-born.
Following this same approach, we get 10 births per thousand for the total native-born compared to 11.2 based on the ACS alone. The above calculation suggests that immigration increased the total birth rate by .9 births per thousand overall, or a little over 9 percent. This is larger than the 6.6 percent increase we reported above using only the ACS, but still modest in size. Our inability to separate out the foreign-born due to how information is collected on birth certificates and the way it is made available from the NVSS means we are unsure how to interpret this number. But the bottom line is even using the information that is available from NVSS data and combining it with the ACS still shows immigration does not have a large impact on overall fertility in the United States.
End Notes
1 Based on the ACS, in 2023 the total population of women ages 15 to 50 in the United States according to the ACS was 78,043,726, and there were 3.997 million births, making for 51.2 births per thousand. Of this population, there were 12.825 million immigrant women who had 783,024 births in that year. If the number of immigrant women were doubled to 25.65 million and the number of births to immigrant women also doubled to 1.566 million, then the total female population (15-50) would be 90.869 million and the total number of births would be 4.78 million. This would raise births per thousand by 1.4, from 51.2 to 52.6, or 2.7 percent.
2 The Census measures population growth from July 1 of each year. (The ACS also reflects the population at mid-year.) In its latest “vintage 2024” population estimates, the Census Bureau went back and revised upward significantly net international migration (NIM) in 2022 and 2023. As a result, the bureau now estimates a significantly larger overall U.S. population in 2022 and 2023 than it previously reported. However, the 2023 ACS used in this report, which is the most recent ACS available, is only weighted to reflect the vintage 2023 population estimates, not the new estimates. If the 2023 ACS was reweighted it would show a larger overall population and more new immigrants as well. In fact, we have a new report based on the Census Bureau’s Current Population Survey from January of this year showing a much larger foreign-born population. The January 2025 CPS is the first Census Bureau survey to be weighted to reflect the bureau’s new estimate of NIM. But just using the 2023 ACS as-is shows the increase in the foreign-born accounted for the overwhelming share of total population growth.
3 The term “immigrant” has a specific meaning in U.S. immigration law, which is all those inspected and admitted as lawful permanent residents. In this analysis, we use the term “immigrant” in the non-technical sense of the word to mean all those who were not U.S. citizens at birth. Typically, the government refers to these individuals in surveys such as the ACS or decennial censuses as the “foreign-born”. While it may surprise some, the Census Bureau, which conducts the ACS is clear that illegal immigrants are included in its surveys. Although there is some undercount, the foreign-born in the ACS includes legal immigrants, long-term temporary visitors (e.g., guestworkers), and illegal immigrants.
4 This includes all those born in the United States, including the children of illegal immigrants and all those born abroad to American citizen parents.
5 Data from 2012 is not used because of a problem reported by the Census Bureau with the fertility variable in that particular year. In its source and accuracy statement for the 2012 ACS, the Census Bureau states that, “the ACS PUMS [Public Use Micro Sample] file has suppressed variables in the 2012 year PUMS file for a limited number of geographies. This is due to non-sampling error or issues with interpreting the recode. The fertility variable (FER) was suppressed in 59 PUMAs [Public Use Microdata Areas] within states [sic] Florida, Georgia, Kansas, Montana, North Carolina, Ohio and Texas.” This comes to 1.8 million (weighted) cases with missing values for the fertility question. Because it is not clear what biases the missing values introduced, we have chosen to exclude the 2012 ACS from this analysis. See p. 10 in “PUMS Accuracy of the Data (2012)”.
6 Mother’s place of birth is available on birth certificates, so a similar measure of births to the foreign-born can be calculated, but it includes mothers born abroad to American parents. Also, NVSS data alone cannot be used to measure birth rates because it must be combined with an estimate of the population. In the case of immigrants (or at least those mothers born abroad), data from the ACS has to be used as the denominator in order to determine a TFR or births per thousand. There are other issues with the NVSS data relative to the ACS that are discussed at length in the appendix of this report.
7 The assumption that younger women will in the future have the same fertility as the current cohort of older women may, of course, turn out to be wrong. Experience has shown that, while not perfect, the TFR does a good job of measuring births to women in their childbearing years. The primary reason that the TFR is so often used in population studies is that it provides a shorthand way of looking at the fertility of all women in their reproductive years.
8 The idea behind the 2.1 number is that each woman has to have one child to replace herself and one man in order for the population to reproduce itself. It has traditionally been assumed that 2.1 children rather than 2.0 children are necessary to sustain the population, partly because there are slightly more boys than girls born each year and because some children will die before becoming adults. It should also be added that if life expectancy is increasing it might be some time before the population actually declines if fertility is below 2.1, even assuming no net immigration.
9 It should be noted this is at least partly a result of compositional change, with African immigrants, who tend to have relatively higher fertility, becoming a larger share of the foreign-born relative to lower-fertility immigrants from the Caribbean of the same race.
10 Regions in the ACS are defined in the following manner: East Asia: China (including Hong Kong and Taiwan), Japan, Korea, Cambodia, Indonesia, Laos, Malaysia, Myanmar, Philippines, Singapore, Thailand, Vietnam, Other Southeastern Asia, Other Eastern Asia, Asia n.e.c.; Indian Subcontinent: Bangladesh, Bhutan, India, Nepal, Pakistan, Sri Lanka; Caribbean: Bahamas, Barbados, Cuba, Dominica, Dominican Republic, Grenada, Haiti, Jamaica, St. Vincent and the Grenadines, Trinidad and Tobago, West Indies, Other Caribbean, Other Northern America; Central America: Belize, Costa Rica, El Salvador, Guatemala, Honduras, Nicaragua, Panama, Other Central America; South America: Argentina, Bolivia, Brazil, Chile, Colombia, Ecuador, Guyana, Peru, Uruguay, Venezuela, Other South America; Middle East: Afghanistan, Iran, Kazakhstan, Uzbekistan, Iraq, Israel, Jordan, Kuwait, Lebanon, Saudi Arabia, Syria, United Arab Emirates, Yemen, Turkey, Algeria, Egypt, Morocco, Sudan, Other Northern Africa, Other South Central Asia, Other Western Asia; Europe: United Kingdom, Ireland, Denmark, Norway, Sweden, Other Northern Europe, Austria, Belgium, France, Germany, Netherlands, Switzerland, Other Western Europe, Greece, Italy, Portugal, Spain, Albania, Belarus, Bulgaria, Croatia, Czech Republic, Slovakia, Hungary, Latvia, Lithuania, Macedonia, Moldova, Poland, Romania, Russia, Ukraine, Bosnia and Herzegovina, Serbia, Armenia, Other Southern Europe, Other Eastern Europe, Europe n.e.c.; Sub-Saharan Africa: Eritrea, Ethiopia, Kenya, Somalia, Tanzania, Other Eastern Africa, Cameroon, South Africa, Other Southern Africa, Cape Verde, Ghana, Ivory Coast, Liberia, Nigeria, Sierra Leone, Togo, Other Western Africa, Other Middle Africa, Africa n.e.c.; Oceania/Elsewhere: Australia, Oceania, Pacific Islands, Fiji, and elsewhere. In the data, “n.e.c” means “not elsewhere classified”.
11 In his paper, “diversity” does not mean non-white. Rather, the author measures the effect of different groups living together. For example, El Paso, Texas, which is overwhelmingly Hispanic, is not diverse as defined in this paper.
12 Teodora Cristina Barbu, Mariana Vuta, Adina Ionela Străchinaru, and Sorin-Iulian Cioaca, “An Assessment of the Immigration Impact on the International Housing Price”, Amfiteatru Economic, 19(46), 2017, pp. 682-695.
13 The ACS also asks respondents where they lived one year earlier. This variable shows roughly 36,538 new mothers were living outside the United States one year prior to being surveyed in 2023; it was 26,274 in 2019.
14 The data tool does have a variable called “mother’s state of birth” that would seem to provide information about mothers who were born in the 50 states separately from U.S. possessions, but outputs generated using this variable are missing births in 2023, at least at the time of this publication. Further, it is still not possible to exclude mothers who were born abroad of American parents. This is not a trivial issue as the 2023 ACS shows nearly 43,000 births to such women.

