Overall Foreign-Born Population Down 2.2 Million January to July
- External Source
admin
- 0
- 35 minutes read
Analysis of the raw data from the Bureau of Labor Statistics’ (BLS) household survey, officially called the Current Population Survey (CPS), shows an unprecedented 2.2 million decline in the total foreign-born or immigrant population (legal and illegal) between January and July of this year. We preliminarily estimate that the number of illegal immigrants has fallen by 1.6 million in just the last six months. This is likely due to increased out-migration in response to stepped-up enforcement. However, analysis based on the CPS comes with caveats.
Findings:
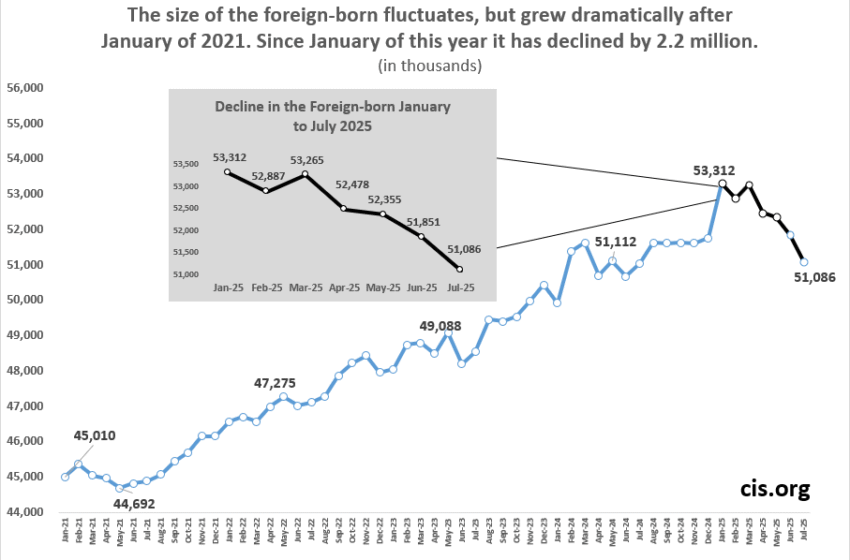
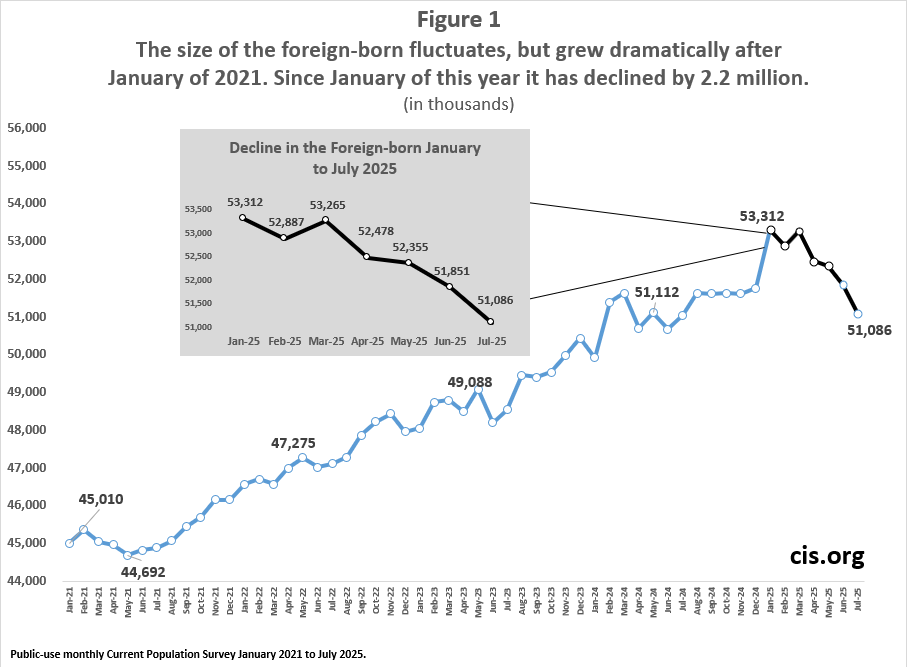
- Analysis of the CPS data shows the total foreign-born population of all ages, both in and out of the labor force, declined an unprecedented 2.2 million from January to July – the largest six-month decline ever within the same year.
- Non-citizens accounted for all of the falloff in the total foreign-born; the naturalized U.S. citizen population has actually increased some since January.
- We preliminarily estimate that the illegal immigrant population declined an astonishing 1.6 million (10 percent) to 14.2 million from January to July of this year.
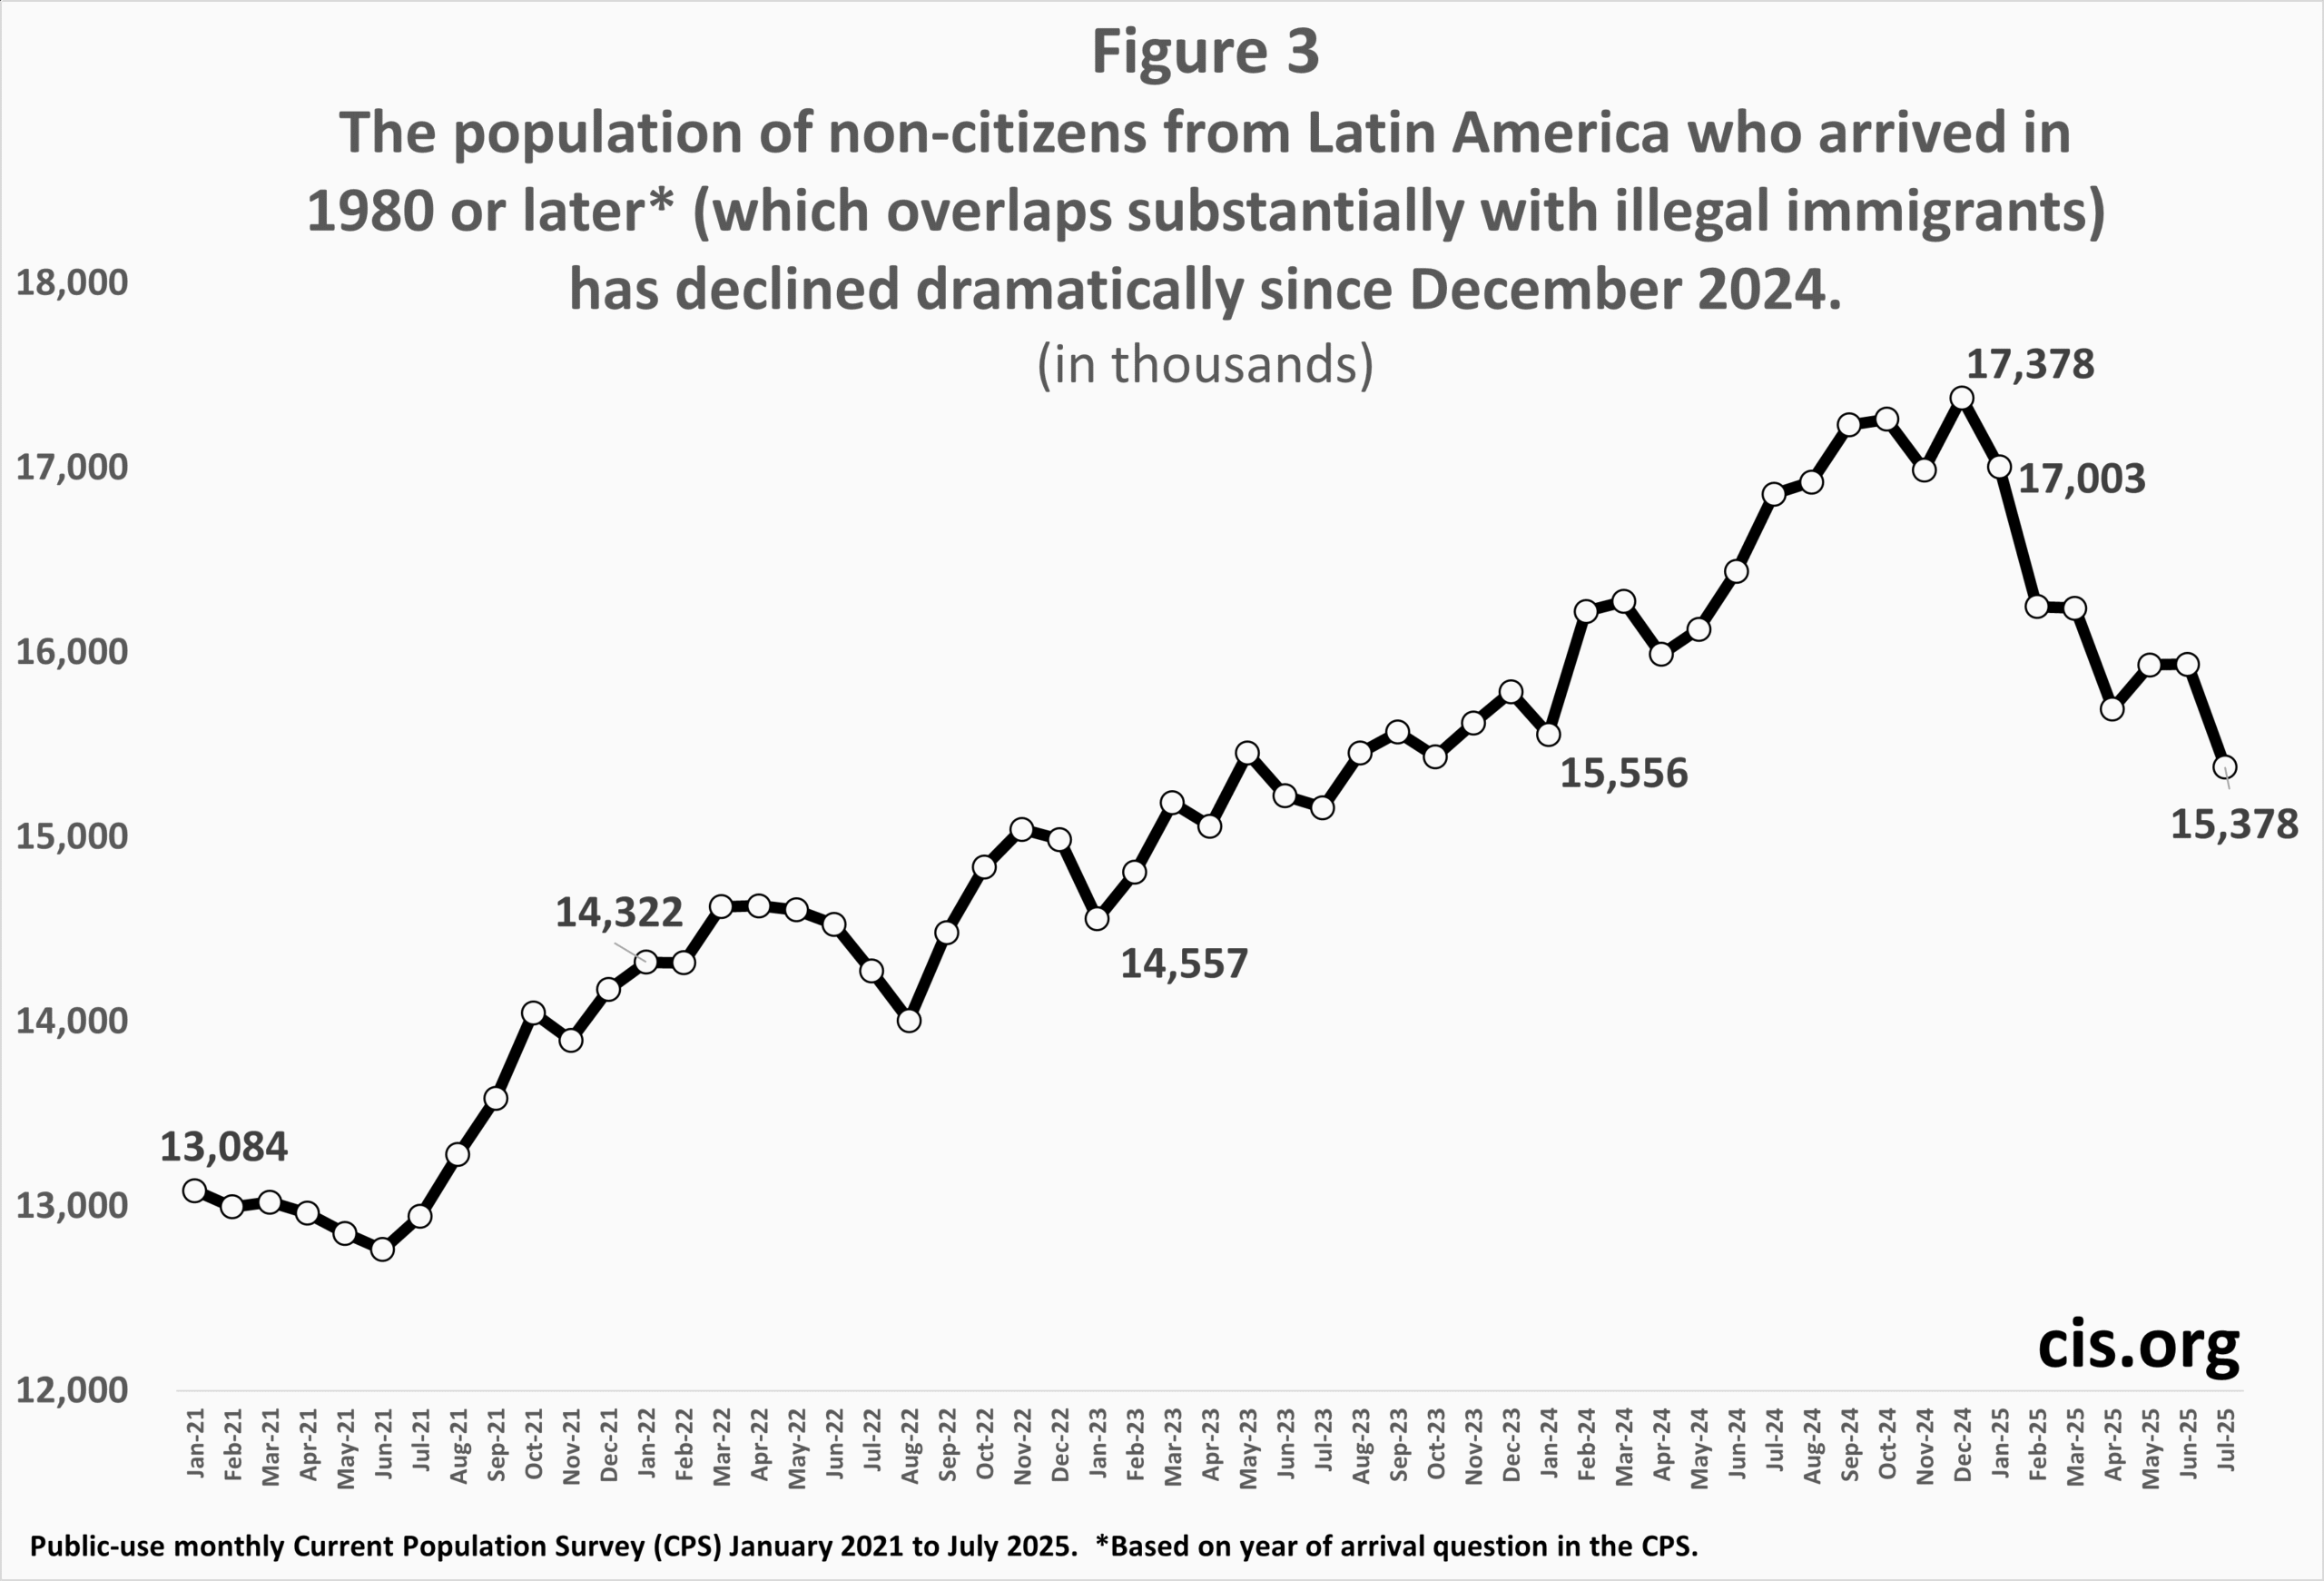
- Confirmation of the decline in the illegal immigrant population can be seen in the 10 percent decrease in the number of non-citizens from Latin America who indicated they arrived in the U.S. in 1980 or later. It is well-established that this population overlaps significantly with illegal immigrants.
- Although some have voiced concern, based on the BLS’s other employment-focused survey, that job growth is underreported, the CPS actually shows significant job growth among the U.S.-born. Further, to the extent employment growth may have slowed overall, it is likely due to illegal immigrants leaving the country.
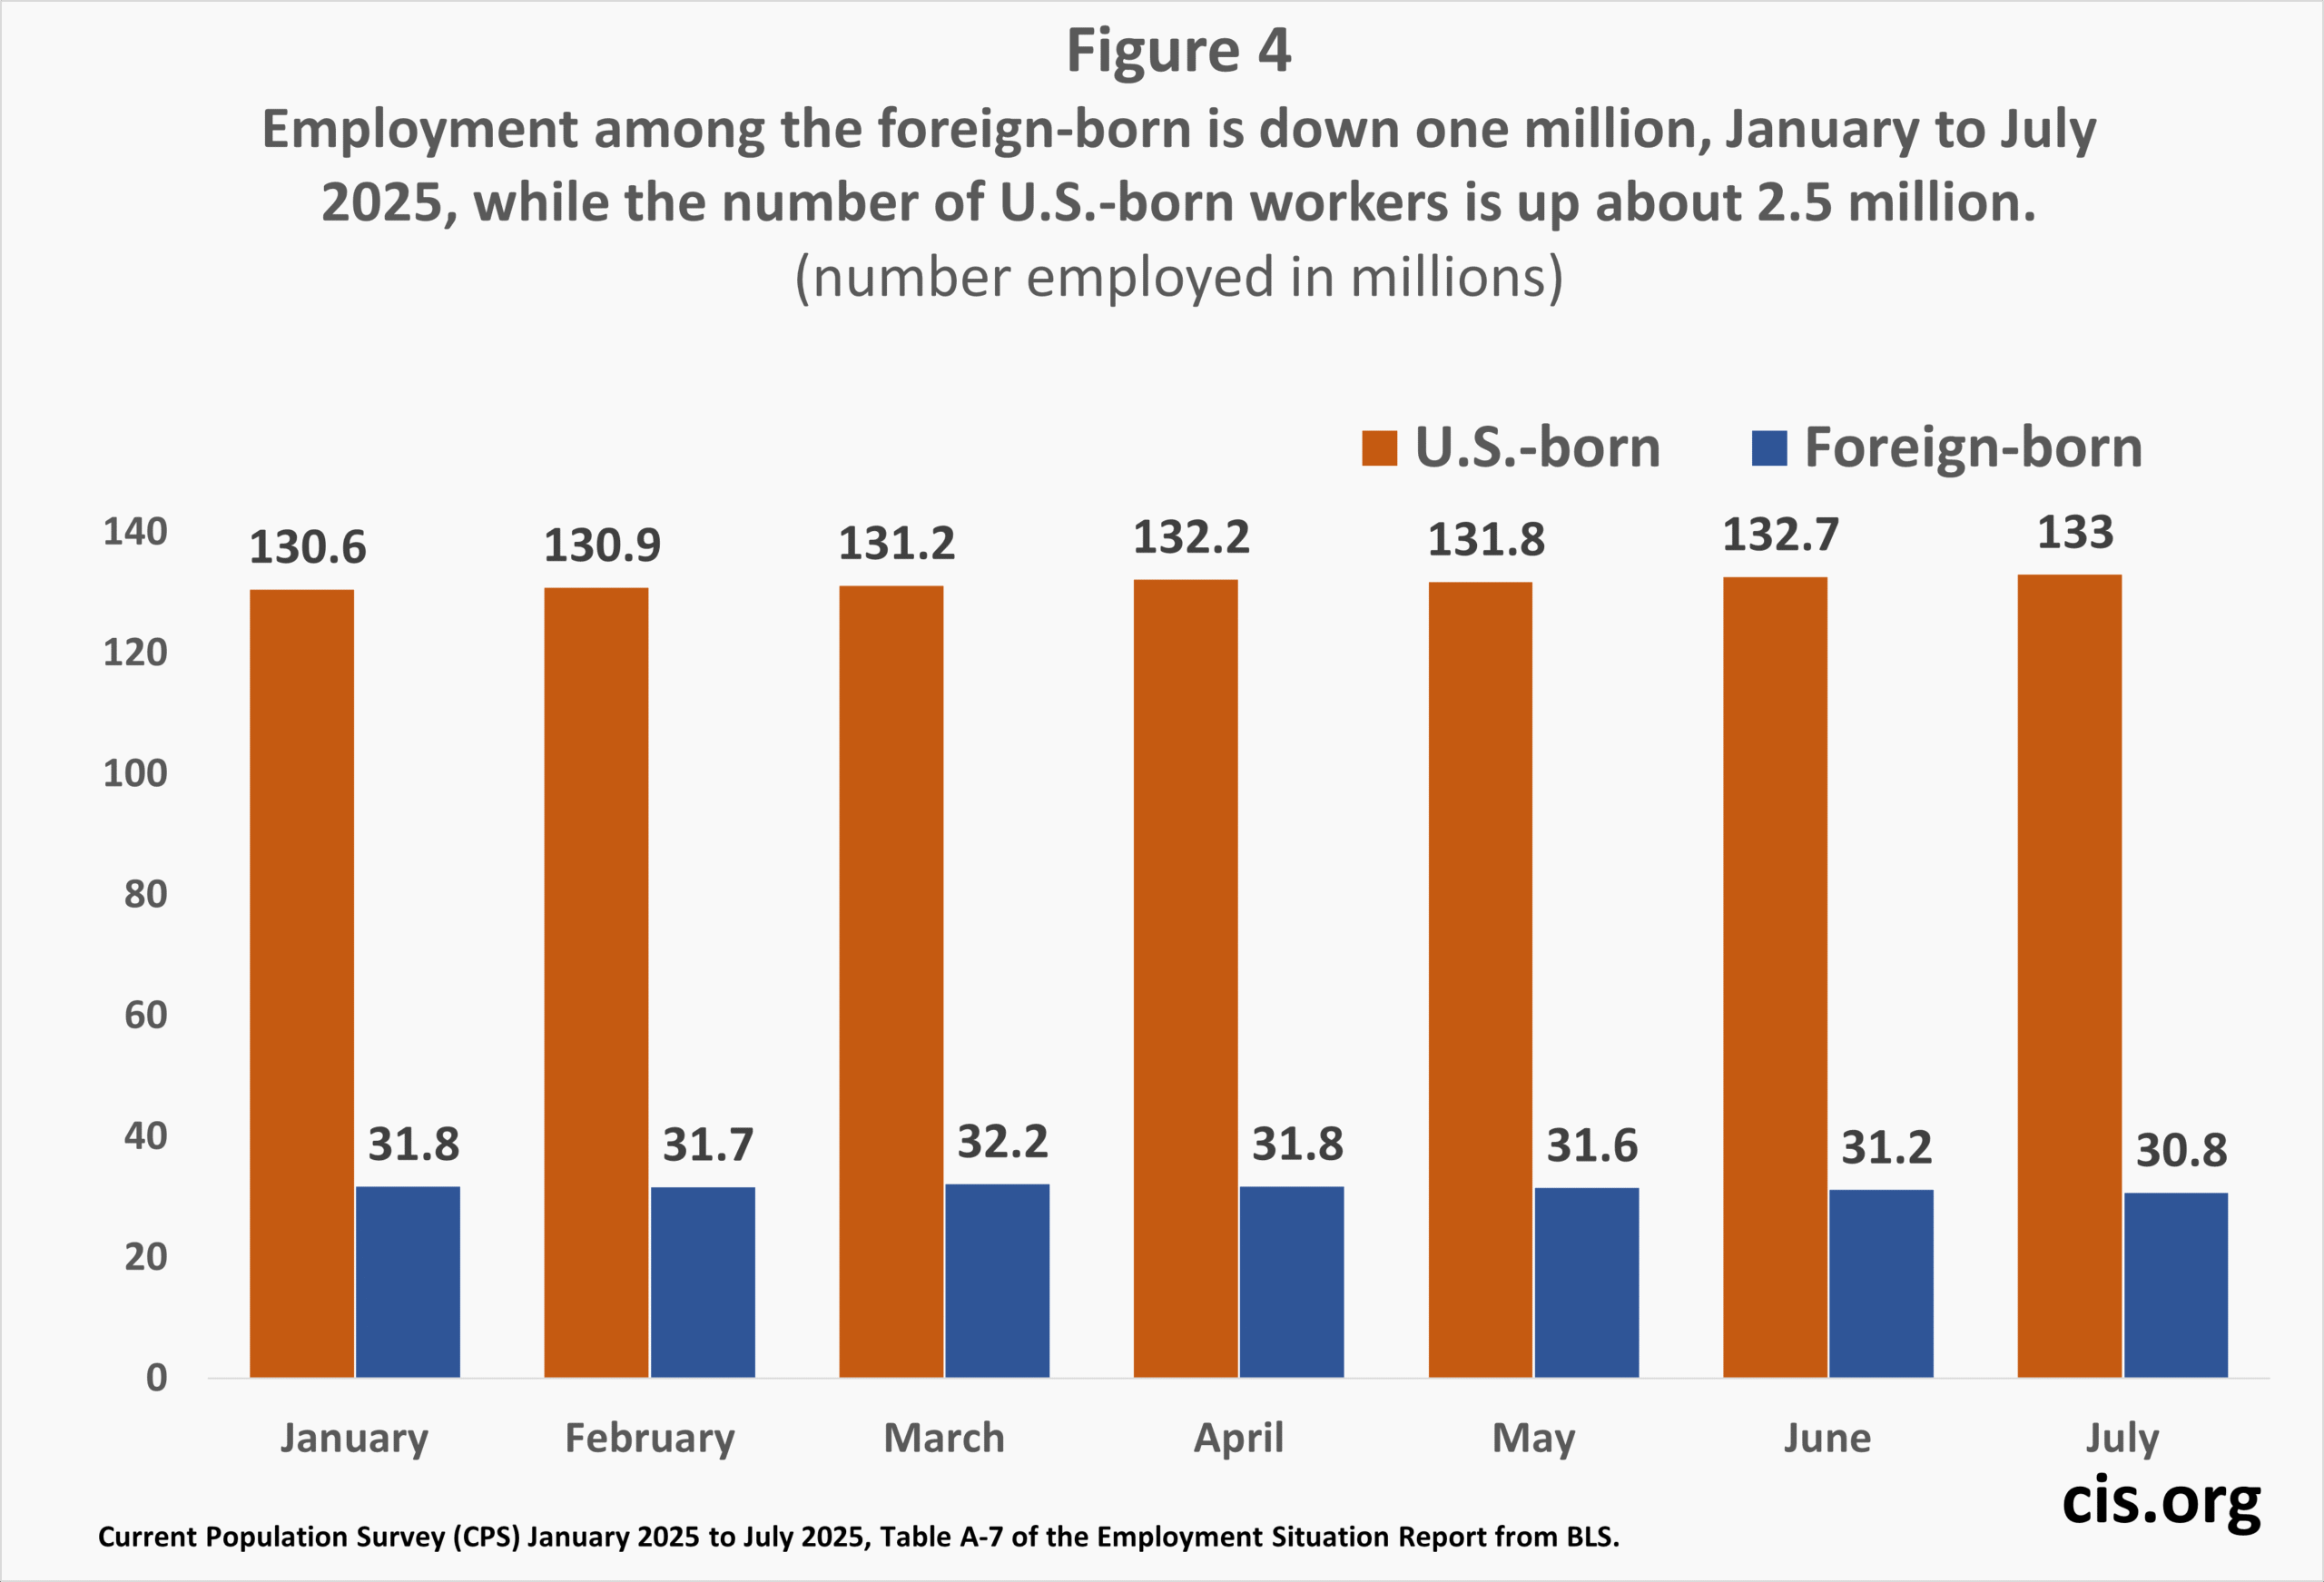
- Based on the CPS, the BLS reports in Table A-7 of the Employment Situation Report that the number of employed foreign-born individuals declined by 1 million from January to July 2025. Table A-7 also shows an increase of 2.5 million workers among the U.S.-born.
- There are a few important caveats. First, given recent stepped-up enforcement efforts, it is possible that the observed decline in the foreign-born was due, at least in part, to a greater reluctance by immigrants to participate in the survey or to identify as foreign-born; 2) Some of the administrative data necessary to estimate illegal immigrants is not yet available, making our estimate for July only preliminary; and 3) Given the way the CPS is designed, employment gains among the U.S.-born, at least in part, may represent a statistical artifact rather than a real trend.
Introduction
Some reporting has focused on the decline of immigrants in the labor market. This analysis goes deeper, using the newly released raw data – typically referred to as the “public-use data” – from the Current Population Survey (CPS). We use the survey, colloquially known as the “household survey”, to measure recent trends in the total foreign-born population (both in and out of the labor force) through July of this year.
Further, there has been much media coverage of the modest job growth in the Bureau of Labor Statistics’ other survey focused on employment, called the “establishment survey”, formally known as the Current Employment Statistics (CES) survey. While raw data from the CES is not available to the public, our analysis of the CPS indicates that the number of foreign-born residents, primarily illegal immigrants, has fallen dramatically from January to July of this year. To the extent that the CES shows weak job growth, it is likely due to the falloff in the number of employed illegal immigrants in the country due to their heading home.
The foreign-born in Census Bureau surveys includes all persons who were not U.S. citizens at birth – mainly naturalized citizens, lawful permanent residents (green card holders), long-term temporary visitors (e.g. guest workers and foreign students), and illegal immigrants. Both the Census Bureau, which collects the CPS, and the BLS, which reports employment trends based on the data, are clear that the survey includes illegal immigrants, though some are missed. We use the terms “immigrant” and “foreign-born” interchangeably in this analysis.1
As the Center has already reported in a prior publication, the foreign-born hit historic highs numerically and as a share of the U.S. population in January 2025 based on the monthly CPS. The January CPS was the first government survey to be weighted to more fully reflect the enormous increase in net international migration that the Census Bureau now observes due to the border surge during the Biden administration.2 The larger American Community Survey (ACS), often used to study immigrants, cannot be used to measure recent trends because it has not been weighted to reflect the Census Bureau’s new migration estimates and only shows the population through July 2023. The CES survey asks employers about the number of workers they have, but it does not survey the whole population or identify the foreign-born, and, most importantly, the raw data is not released to the public. The CPS is the only up-to-date public data source that allows for analysis of the total foreign-born population.
Findings
Trends in the Total Foreign-born. Figure 1 reports the total foreign-born population in the United States from January 2021 to July 2025, reflecting the most recent data available. There is certainly variation in the data, but the trend had been upward in the preceding four years. However, since January 2025 the trend has been in the other direction, declining nearly 2.23 million since the start of this year. This is a huge and statistically significant decline, indicating something has fundamentally changed.3 This is by far the largest six-month decline that has ever occurred within the same year in the CPS since January of 1994 when the CPS began to ask about citizenship on a regular basis.4
 |
Decline in Non-citizens. Figure 2 shows that the decline in the foreign-born since January has been entirely among those who are not U.S. citizens. The number of non-citizens is down 2.6 million, while the number of naturalized citizens is actually up 373,000.5 In short, all of the 2.2 million decline in the foreign-born is among those who are not U.S. citizens. The decline in the non-citizen population, like the decline in the overall foreign-born, is statistically significant. Since illegal immigrants are not citizens, the decline in the number of people who are not American citizens is consistent with what would be expected if the number of illegal immigrants fell.
 |
Non-citizens from Latin America. Respondents to the CPS are asked when they came to the United States. Illegal immigrants should show up in Census Bureau surveys as having arrived in 1980 or later due to the 1986 IRCA amnesty other factors.6 This is why our estimate of illegal immigrants, and that of DHS, both subtract the legal immigrant population from the total post-1980 foreign-born in Census Bureau data to arrive at the number of illegals.7 As already mentioned, most illegal immigrants should also identify as non-citizens. Also, prior research by DHS, the Pew Research Center, the Center for Migration Studies, and the Migration Policy Institute all indicate that roughly three-fourths of illegal immigrants are from Latin America.8 We also know that 80 percent of those encountered at the nation’s borders from January 2021 to June 2025 are from Latin American countries. As a result, the size of the non-citizen Latin American population who arrived in 1980 or later is highly correlated with the illegal immigrant population.
Figure 3 shows post-1980 non-citizen Latin Americans from January 2021 to July 2025. Their number increased significantly from January 2021 to December 2024, which is what we would expect given the border surge and the number of people flown into the country and released under the CHNV program. But from January to July 2025, the number of post-1980 Latin American non-citizens declined by 1.6 million or about 10 percent.9 Although this population accounts for a little less than one-third of the immigrant population, they represent 73 percent of the decline in the total foreign-born in the last six months. The decrease for post-1980 non-citizen Latin Americans is statistically significant.10 The decline in this population from December 2024 to July 2025 is even larger at 2 million.11 These results strongly support the idea that the election of Donald Trump, his rhetoric, high-profile enforcement actions, and border policies have caused a large number of illegal immigrants to leave the country and many fewer to enter.
 |
Decline in Immigrants Responding to the Survey. Like virtually all modern surveys, the CPS is weighted to reflect the size and composition of the total population. The weights are based on Census Bureau estimates of births, deaths, and net international migration. The total population is controlled to certain key demographic variables such as race, sex, age, and Hispanic origin. Citizenship, country of birth, and year of arrival are not control variables and are allowed to vary based on responses to the survey, as is the case for, say, unemployment or income.12 The CPS from January to July of this year shows a decline in the number of foreign-born unweighted respondents of 8.7 percent compared to the 4.2 percent for weighted responses.13 This large falloff in unweighted foreign-born respondents is another indication that prior growth trends have reversed.
Interestingly, the number of unweighted U.S.-born respondents has declined by 3.5 percent since January.14 Given the heightened enforcement environment in recent months, an increasing share of foreign-born residents might claim to be U.S.-born, reducing the size of the foreign-born population in the survey. But the decline in the number of unweighted U.S.-born respondents indicates this is unlikely to be the case. Further both the number of unweighted naturalized citizens (2.4 percent) and non-citizens (14.8 percent) respondents declined as well.15 So it also does not seem to be the case that non-citizens are claiming to be naturalized citizens either. However, additional analysis needs to be done to rule out this possibility.
Employment Figures. Figure 4 reports employment trends in the number of immigrants and the U.S.-born since January of this year. The number of immigrants employed is down 1.01 million, while employment among the U.S.-born is up 2.46 million. The enormous employment gains of the U.S.-born are certainly good news. However, given the way the weighting system works in the CPS, if the overall foreign-born population declines in the survey, it must be accompanied by an increase in the overall U.S.-born because individuals can only be U.S.- or foreign-born.16 This means for example, that a decline in the number of immigrant workers between January and July will tend to be accompanied by an increase in the number of U.S.-born Americans working. Of course, the decrease in the number of foreign-born workers need not correspond to a one-to-one increase in U.S.-born workers because being employed is not a control variable and instead varies based on survey responses. But this does mean that the 2.46 million increase in the number of employed U.S.-born Americans since January may be in part a statistical artifact due to the falloff in the foreign-born.
 |
Illegal Immigrants. The Center has used the Current Population Survey in the past to estimate the illegal immigrant population in the United States. The survey does not specifically identify illegal immigrants; but like other researchers we use the information in the survey, and other information from outside the survey, to estimate the population living in the country without authorization.17 As we have described in our earlier analysis, we follow DHS’s Office of Homeland Security Statistics approach and first estimate the legal immigrant population that arrived in 1980 or later, allowing for deaths and outmigration, and then subtracting this estimate from the foreign-born population in the survey.18
Not all of the administrative data needed to estimate the legal immigrant population in July 2025 is available yet. But based on prior trends and what limited information is available, we preliminarily estimate that the post-1980 legal immigrant population was 31.7 million in July of this year. Subtracting this number from the 45.47 million post-1980 immigrants in the July CPS produces an estimate of 13.8 million illegal immigrants in the data.19 Making the same adjustment for undercount in the data as we did in our earlier analysis, based on the January 2025 CPS, puts the total illegal immigrant population at 14.2 million in July of this year. If correct, this would represent an extraordinary decline of 1.6 million or 10 percent of the illegal immigrant population in just the last 6 months (see Figure 5).
 |
Caveats about our estimate of illegal Immigrants. The falloff in the overall foreign-born, non-citizen, and post-1980 non-citizen Latin American populations are all statistically significant. However, given the recent stepped-up enforcement efforts, it is possible that immigrants have become more reluctant to respond to the CPS.20,21 If this is the case, then our estimate of illegal immigrants based on the survey may be overstating the decline in their actual numbers. Further, our estimate of legal immigrants based on administrative data through July of 2025 is incomplete, further increasing uncertainty of our estimate of illegal immigrants. All this should be kept in mind when interpreting the figures presented here.
Conclusion
This analysis shows that the number of foreign-born residents in the country declined by an unprecedented 2.2 million in the Current Population Survey from January to July 2025. We also find statistically significant declines in the number of non-citizens overall and the number of non-citizens from Latin America who arrived in the United States in 1980 or later. The post-1980 Latin American non-citizen population in particular overlaps significantly with the illegal immigrant population and helps to confirm our finding of a large decline in the illegal immigrant population. Our preliminary estimate is that the number of illegal immigrants declined 1.6 million, from 15.8 million in January of this year to 14.2 million in the July. This reverses the dramatic increase in the illegal immigrant population we have reported from January 2021 to January 2025.
While employers may be unhappy with a decline in illegal immigrant workers, reducing the supply of labor is likely to be very helpful to less-educated U.S.-born and legal-immigrant workers, whose wages may rise as a result. Further, a tighter labor market and higher wages may help to draw back into jobs the near-record number of working-age American men without a college degree not in the labor force. Policymakers will need to consider these positive effects of reducing illegal immigration as they respond to pressure from employers to reverse the decline.
Endnotes
1 The term “immigrant” has a specific meaning in U.S. immigration law, which is all those inspected and admitted as lawful permanent residents (green card holders). In this analysis, we use the term “immigrant” in the non-technical sense to mean all those who were not U.S. citizens at birth.
2 The BLS reports that if the new weights are applied back to the December 2024 CPS, it adds 2.87 million people to the 16-plus population in the United States. The BLS is very clear that the increase in the population was due to the bureau’s new, dramatically higher estimate of migration reflecting the border surge 2021 to 2024.
3 Calculating unbiased standard errors and resulting significance tests requires a specific formula provided by the BLS and what are called “parameter estimates” to account for the non-random complex design of the CPS. We use the parameter provided by the BLS for foreign-born individuals ages 16+, as no parameters are provided for the total foreign-born. Comparing the change in the foreign-born population from January to July shows it is statistically significant at the 99 percent level.
4 In the 31 years that the CPS has collected data on the foreign-born, it has never declined by anything like 2.23 million from January to July. However, the total foreign-born did decline by slightly more (2.29 million) between the six months from December of 2000 and June 2001. But the survey is reweighted every January, and it is unclear what role this re-weighting played in the decline back then. In contrast, the decline in the last six months is within the same year, when the same weighting scheme is used.
5 In FY 2024 about 70,000 lawful permanent residents naturalized per month on average, so the recent increase is not really surprising.
6 See endnote 18 for more discussion of this issue.
7 DHS uses the American Community Survey, and its newest estimate of illegal immigrants is only for the beginning of 2022. See Table A1-1 in the DHS estimates of the unauthorized.
8 Countries in Latin America in the CPS include Mexico, Belize, Costa Rica, El Salvador, Guatemala, Honduras, Nicaragua, Panama, Cuba, Dominican Republic, Haiti, Jamaica, Bahamas, Barbados, Dominica, Grenada, Trinidad and Tobago, Antigua and Barbuda, St. Kitts-Nevis, St. Lucia, St. Vincent and the Grenadines, Argentina, Bolivia, Brazil, Chile, Colombia, Ecuador, Guyana/British Guiana, Peru, Uruguay, Venezuela, Paraguay, South America not specified, Caribbean not specified, and the Americas not specified.
9 The number of unweighted Latin American post-1980 non-citizens declined nearly 18 percent in the CPS from January to July of this year.
10 See endnote 3 for more discussion on statistical significance in the CPS.
11 This decline is all the more surprising because the survey is readjusted every January, and the readjustment for 2025 substantially increased the foreign-born, as we discussed in our analysis of the January data. This means that, all other things being equal, the size of this population should be lower in December 2024 than in July 2025.
12 One consequence of the weighting system used in a survey like the CPS is that the overall size of the population is determined at the start of the year and then adjusted upward based on the control variables used by the government such as race, age, sex, and so on. As such, the overall population, particularly Hispanics and Asians, are assumed to grow throughout 2025, partly because the government assumed the number of immigrants in the country would continue to grow. This is important when measuring the foreign-born because being Asian or Hispanic is correlated with being an immigrant. As a result, the increase in the sample weights for these populations will actually bias the survey towards showing an increase in the foreign-born, though being foreign-born is itself not a control variable and varies based on respondent answers. The decline in the foreign-born in the face of the weighting scheme used in the CPS lends support to the idea that the number of immigrants in the country has actually declined.
13 The unweighted sample of the total foreign-born declined 1,108 – from 12,708 in January to 11,600 in July of this year.
14 The unweighted sample of U.S.-born residents declined 2,983 – from 85,018 in January to 82,035 in July of this year. This means the decline in the U.S.-born sample is larger than the numerical decline in the sample of immigrants.
15 The unweighted sample of non-citizens declined 957 – from 6,446 in January to 5,489 in July of this year. Over the same time period the unweighted sample of naturalized citizens declined from 6,262 in January to 6,111 in July.
16 Reflecting a built-in assumption of population growth incorporated into the sample weights, the total population of the United States, working and not working, in the July CPS was 889,000 larger than the total population in the January CPS. Since the foreign-born fell by 2.2 million, the U.S.-born had to increase by 2.2 million plus the 889,000 to reflect overall population growth. While the U.S.-born most certainly increased some January to July, the 3.1 million increase in the total U.S.-born is artificially inflated due to the decline in the foreign-born.
17 Our definition of illegal immigrants includes those with pending defensive asylum applications, those with Deferred Action for Childhood Arrivals (DACA), those with Temporary Protected Status (TPS), and parolees. All of the above individuals are inadmissible aliens under the Immigration and Nationality Act (INA), and the vast majority are subject to removal. However, some researchers might not count most parolees in particular as illegal immigrants.
18 Due to the passage of time and the 1986 IRCA amnesty of illegal immigrants, there should be virtually no illegal immigrants living in the United States who arrived prior to 1980. In addition, Section 249 of the Immigration and Nationality Act (INA) allows individuals who have lived in the United States since January 1972 to apply for lawful permanent residency under what is often referred to as the “registry provision” of the law. This provision also makes it very unlikely that there are substantial numbers of pre-1980 illegal immigrants in the country.
19 This number represents a refinement of our prior method. We had assumed in our prior analysis that all post-1980 Cuban immigrants in the data were here legally because they would have taken advantage of the Cuban Adjustment Act. As a result, we excluded them from the population of potential illegal immigrants. However, for this estimate we follow the example of the Department of Homeland Security and allow for the possibility that Cubans can be illegal immigrants if they arrived in 2017 or later due to the termination of the so-called wet-foot/dry-foot policy.
20 The fact that there has not been a decline in naturalized citizens or even long-time non-citizens is an indication that the foreign-born in general are still willing to respond and identify as such. The decline is entirely among the foreign-born this year, mostly among Latin Americans who arrived in 1980 or later. Further, respondents are in the survey for four months, out for eight months, and back in for four months, so there is a pre-existing relationship with the Census Bureau for the vast majority of those taking part in the survey in any given month. At least in the short term, this relationship should largely preclude respondents from changing their responses on the citizenship question or any other question, which is one reason the survey is designed this way. The relationship with survey takers should also make respondents more likely to accurately report the presence of foreign-born members of their household. It should also be noted that only non-citizens are asked about their citizenship when they rotate back into the survey after being out for 8 months.
21 As already discussed, the decline in the number of unweighted immigrants in the survey from January to July 2025 could indicate immigrants are still here but choosing not to respond to the survey. However, the decrease in the number of immigrants in the survey is also consistent with an actual decline in this population. Further, as already noted, the number of unweighted U.S.-born respondents has also declined.

